Intervals, Graphs And Charts, Measurements Worksheet With Answers Page 5
ADVERTISEMENT
 1
1 2
2 3
3 4
4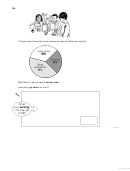 5
5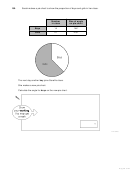 6
6 7
7 8
8 9
9 10
10 11
11 12
12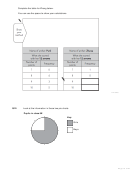 13
13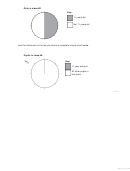 14
14 15
15 16
16 17
17 18
18 19
19 20
20 21
21 22
22 23
23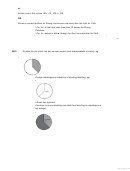 24
24 25
25 26
26 27
27Q4.
This pie chart shows the lunch choices of year 6 children at a school.
28 children in year 6 have a school meal.
How many go home for lunch?
2 marks
Page 5 of 27
ADVERTISEMENT
0 votes
Related Articles
Related forms


Related Categories
Parent category: Education