Two Way Tables And Relative Frequency Worksheet Page 2
ADVERTISEMENT
 1
1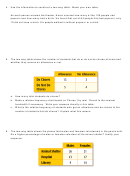 2
2 3
34. Use the information to construct a two-way table. Make your own table.
As each person entered the theater, Aaron counted how many of the 105 people had
popcorn and how many had a drink. He found that out of 84 people that had popcorn, only
10 did not have a drink. Six people walked in without popcorn or a drink.
5. The two way table shows the number of students that do or do not do chores at home and
whether they receive an allowance or not.
a. How many total students do chores?
b. Make a relative frequency chart based on Chores. (by row) Round to the nearest
hundredth if necessary. Write your answers directly in this table.
c. What is the relative frequency of students who get an allowance and do chores to the
number of students that do chores? Explain what this means.
6. The two-way table shows the places that males and females volunteered in the past month.
Do a higher percentage of males or females volunteer at the animal shelter? Justify your
response.
ADVERTISEMENT
0 votes
Related Articles
Related forms


Related Categories
Parent category: Education