Two Way Tables And Relative Frequency Worksheet Page 3
ADVERTISEMENT
 1
1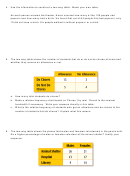 2
2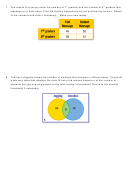 3
3th
th
7. The results of a survey show the number of 7
graders and the number of 8
graders that
message on a daily basis. Find the relative frequencies by row and then by column. Round
to the nearest hundredth if necessary. Make your own tables.
8. The Venn diagram shows the number of students that exercise in different ways. Construct
a two-way table that displays the data. What is the relative frequency of the number of
students that jog and do aerobics to the total number of students? Round to the nearest
hundredth if necessary.
ADVERTISEMENT
0 votes
Related Articles
Related forms


Related Categories
Parent category: Education