Stab22 Midterm Examination Solutions - University Of Toronto Scarborough, 2007 Page 8
ADVERTISEMENT
 1
1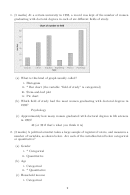 2
2 3
3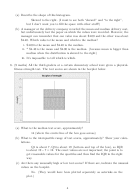 4
4 5
5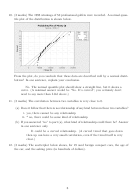 6
6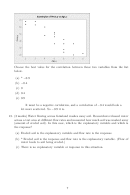 7
7 8
8 9
9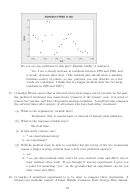 10
10 11
1114. (7 marks) A study was made of some popular fast-food items. In particular, a regression
analysis was done for predicting calorie content from the amount of fat in a food item.
Some regression output from Minitab is given below:
Regression Analysis: Calories versus Fat
The regression equation is
Calories = 242 + 7.35 Fat
Predictor
Coef SE Coef
T
P
Constant
242.03
68.44 3.54 0.003
Fat
7.353
2.860 2.57 0.021
S = 152.030
R-Sq = 29.2%
R-Sq(adj) = 24.8%
(a) What is the value of the slope of this regression line?
7.35.
(b) Which is the best interpretation of the slope of this regression line?
i. The calorie content of an item that has no fat
ii. The fat content of an item that has no calories
iii. * The increase in calories associated with a one-unit increase in fat
iv. The increase in fat associated with a one-calorie increase.
(c) Predict the calorie content of an item containing 15 units of fat.
242 + (7.35)(15) = 352.25. The important part is showing that you
knew the right calculation to do, though getting it right is nice!
15. (3 marks) The plot below shows a scatterplot for two variables x and y.
Which of the statements below about the correlation between x and y is most accurate?
8
ADVERTISEMENT
0 votes
Related Articles
Related forms

 Mathematics B Regents High School Examination Worksheet- University Of The State Of New York, 2007
Education
Mathematics B Regents High School Examination Worksheet- University Of The State Of New York, 2007
Education
 Mathematics B Regents High School Examination - The University Of The State Of New York, 2007
Education
Mathematics B Regents High School Examination - The University Of The State Of New York, 2007
Education


 Cot3100 - Discrete Structures And Applications - Homework 2 Solution - University Of Florida
Education
Cot3100 - Discrete Structures And Applications - Homework 2 Solution - University Of Florida
Education


Related Categories
Parent category: Education