Stab22 Midterm Examination Solutions - University Of Toronto Scarborough, 2007 Page 9
ADVERTISEMENT
 1
1 2
2 3
3 4
4 5
5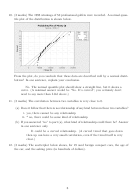 6
6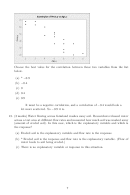 7
7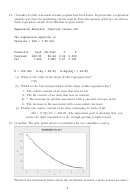 8
8 9
9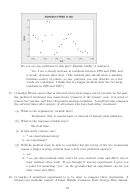 10
10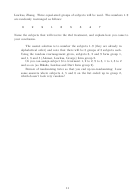 11
11(a) The correlation is +1 because there is a perfect positive association.
(b) The correlation is a little less than +1 because the trend is slightly curved.
(c) The correlation is 0 because the trend is not linear.
(d) * The correlation is a little greater than −1 because the trend is slightly curved.
(There is clearly some kind of downward trend, so the correlation ought to be
negative; having a non-linear relationship will tend to make the correlation closer
to 0 than it would otherwise have been, but won’t make it exactly 0 except in
special cases (compare q. 11)).
(e) The correlation is −1 because there is a perfect negative association.
16. (7 marks) A study was made of the price (dollars per pound) and consumption (pounds
per person per year) of beef in the United States for each year 1970–1993. The prices
were adjusted to 1993 dollars, because everything got more expensive in this time
period.
(a) Economic theory says that if the price of an item is higher, consumption of that
item will be less. A scatter plot for predicting consumption from price is shown
below.
Does this scatterplot support the economic theory? Explain briefly (1 sentence).
No. There should be a downward trend, but here the trend is nonex-
istent or slightly upwards.
(b) A regression was done for predicting consumption from price. The residuals were
plotted against the year, as shown below.
9
ADVERTISEMENT
0 votes
Related Articles
Related forms

 Mathematics B Regents High School Examination Worksheet- University Of The State Of New York, 2007
Education
Mathematics B Regents High School Examination Worksheet- University Of The State Of New York, 2007
Education
 Mathematics B Regents High School Examination - The University Of The State Of New York, 2007
Education
Mathematics B Regents High School Examination - The University Of The State Of New York, 2007
Education


 Cot3100 - Discrete Structures And Applications - Homework 2 Solution - University Of Florida
Education
Cot3100 - Discrete Structures And Applications - Homework 2 Solution - University Of Florida
Education


Related Categories
Parent category: Education