Chapter 9 Algebra Worksheet With Answers - Montville Township Public Schools Page 27
ADVERTISEMENT
 1
1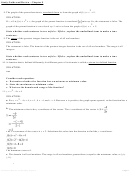 2
2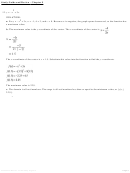 3
3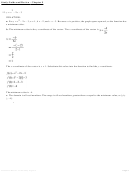 4
4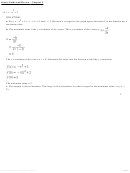 5
5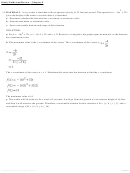 6
6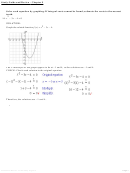 7
7 8
8 9
9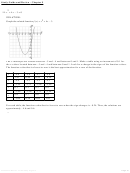 10
10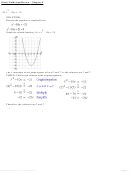 11
11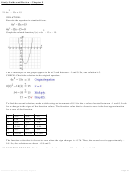 12
12 13
13 14
14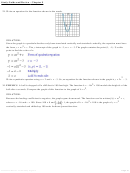 15
15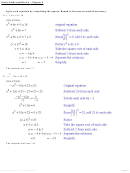 16
16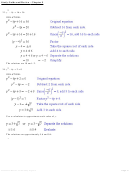 17
17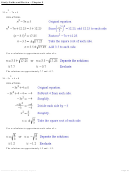 18
18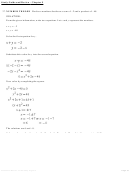 19
19 20
20 21
21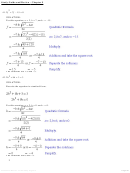 22
22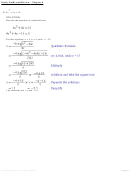 23
23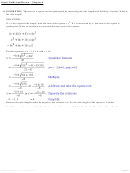 24
24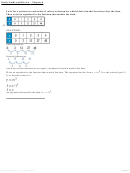 25
25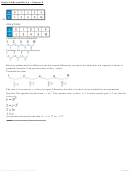 26
26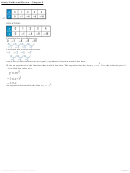 27
27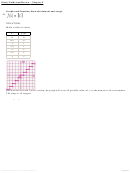 28
28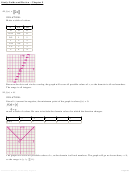 29
29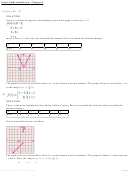 30
30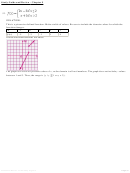 31
31Study Guide and Review - Chapter 9
x
x
An equation that models the data is y = 1 • 2
or y = 2
.
47.
SOLUTION:
Calculate the first differences.
Calculate the second differences.
Since the second differences are equal, a quadratic function models the data.
2
Write an equation for the function that models the data. The equation has the form y = ax
. Use the ordered pair (1,
–1) to find the value of a.
2
An equation that models the data is y = –x
.
Graph each function. State the domain and range.
48.
SOLUTION:
Make a table of values.
x
f (x)
0
0
0.5
0
1
1
1.5
1
2
2
2.5
2
3
3
Because the dots and circles overlap, the graph will cover all possible values of x, so the domain is all real numbers.
eSolutions Manual - Powered by Cognero
Page 27
The range is all integers.
ADVERTISEMENT
0 votes
Related Articles
Related forms


Related Categories
Parent category: Education