Chapter 9 Statistics Worksheet With Answers
ADVERTISEMENT
 1
1 2
2 3
3 4
4 5
5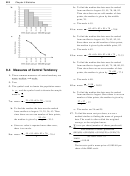 6
6 7
7 8
8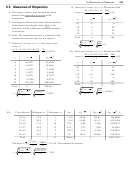 9
9 10
10 11
11 12
12 13
13 14
14 15
15 16
16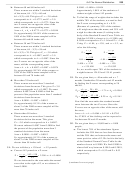 17
17 18
18 19
19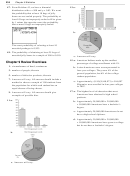 20
20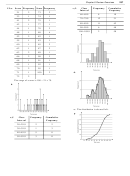 21
21 22
22 23
23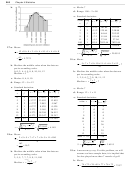 24
24 25
25 26
26 27
27 28
28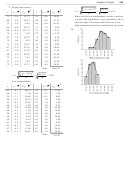 29
29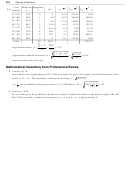 30
30Chapter 9 Statistics
9.1 Introduction to Statistics: Data
5. a.
and Sampling
1. A measurable characteristic is called a variable.
3. False. A discrete variable can assume only a
finite set of values or as many values as there
are whole numbers.
5. The variable is the number of heads thrown, and
it is discrete.
7. The variable is the miles per gallon (or average
b. The west has the highest median income.
gas mileage), and it is continuous.
c. The south has the lowest median income.
9. The variable is the time of waiting in line, and it
d. Answers will vary. All discussions should
is continuous.
conclude that pie charts are inappropriate.
11. The variable is the number of flights, and it is
7. a.
discrete.
13. The variable is the number of people crossing
the intersection, and it is discrete.
15. The variable is length of time, and it is
continuous.
17. Answers will vary. All answers should include a
method to choose a group of viewers for which
each viewer of the program has an equal chance
of being chosen.
19. Answers will vary. All answers should include a
method to choose a sample in which each
b.
member of the population has an equal chance
of being selected.
21. Answers will vary. All answers should include a
method to choose a sample in which each
member of the population has an equal chance
of being selected.
23.−25. Answers will vary. All answers should give
examples of possible bias.
c. Answers will vary.
9.2 Representing Qualitative Data
d. The south has the most families.
Graphically: Bar Graphs; Pie
e. The midwest has the fewest families.
Charts
1. Two popular ways to display data that can be
separated in categories are in bar graphs and pie
charts.
3. False. In a pie chart a circle is divided into
sectors, one sector for each category represented
by the data. The size of each sector is
proportional to the size of the category.
217
ADVERTISEMENT
0 votes
Related Articles
Related forms


Related Categories
Parent category: Education