Chapter 9 Algebra Worksheet With Answers - Montville Township Public Schools Page 28
ADVERTISEMENT
 1
1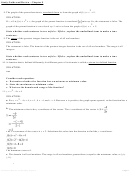 2
2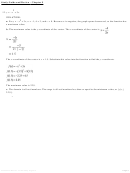 3
3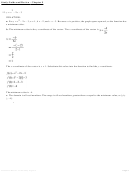 4
4 5
5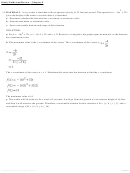 6
6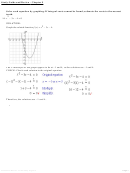 7
7 8
8 9
9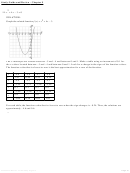 10
10 11
11 12
12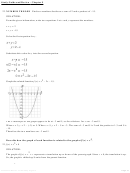 13
13 14
14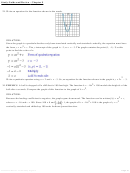 15
15 16
16 17
17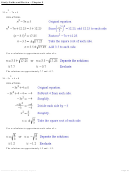 18
18 19
19 20
20 21
21 22
22 23
23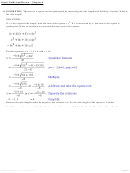 24
24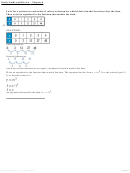 25
25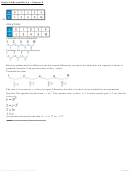 26
26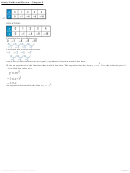 27
27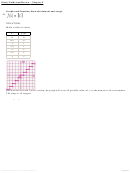 28
28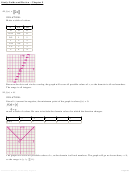 29
29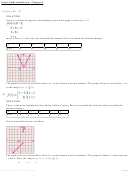 30
30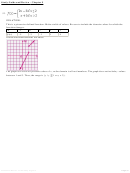 31
31Study Guide and Review - Chapter 9
2
An equation that models the data is y = –x
.
Graph each function. State the domain and range.
48.
SOLUTION:
Make a table of values.
x
f (x)
0
0
0.5
0
1
1
1.5
1
2
2
2.5
2
3
3
Because the dots and circles overlap, the graph will cover all possible values of x, so the domain is all real numbers.
The range is all integers.
49. f (x) =
SOLUTION:
Make a table of values.
x
2x
f (x)
0
0
0
0.25
0.5
0
0.5
1
1
1
2
2
1.25
2.5
2
1.5
3
3
2
4
4
eSolutions Manual - Powered by Cognero
Page 28
Because the dots and circles overlap, the graph will cover all possible values of x, so the domain is all real numbers.
The range is all integers.
ADVERTISEMENT
0 votes
Related Articles
Related forms


Related Categories
Parent category: Education