Math 1530-017 Exam 1 With Answer Key - 2009 Page 2
ADVERTISEMENT
 1
1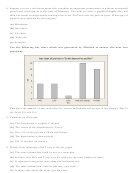 2
2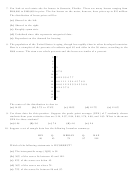 3
3 4
4 5
5 6
6 7
7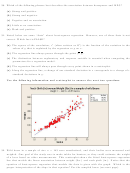 8
8 9
9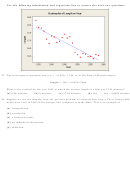 10
10 11
114. Suppose you are a real estate agent who is making an important presentation at a forum on regional
growth and development in the state of Tennessee. You want to create a graphical display that will
show the trends in single-family housing costs in the Tri-Cities over the past 20 years. What type of
graph is most suitable for this purpose?
(a) Histogram.
(b) Bar chart.
(c) Pie chart.
(d) Time plot.
(e) Stemplot.
Use the following bar chart which was generated by Minitab to answer the next two
questions.
This gives the number of pies-in-the-face for various individuals and groups in the Stooges’ film In
the Sweet Pie and Pie.
5. Comment on this graph.
(a) The distribution is roughly U-shaped.
(b) The center of the distribution is “Larry.”
(c) Over 1/3 of the pies hit a “Male non-Stooge.”
(d) The distribution is skewed right.
(e) 10% of the pies hit females.
6. Which of the following is NOT true of the bar graph:
(a) The same information could be put in a stem plot.
(b) It shows that Moe and Curly were hit with pies the same number of times.
(c) It represents categorical data along the horizontal axis.
(d) The same information could be put into a pie chart.
(e) It shows that about 3% of the pies hit Larry.
ADVERTISEMENT
0 votes
Related Articles
Related forms


Related Categories
Parent category: Education