Math 1530-017 Exam 1 With Answer Key - 2009 Page 6
ADVERTISEMENT
 1
1 2
2 3
3 4
4 5
5 6
6 7
7 8
8 9
9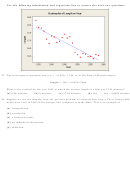 10
10 11
1120. Suppose the number of slaps per film of the Three Stooges films has distribution N(13.00, 4.50). The
Stooges’ 24th film, Goofs and Saddles, has 8 slaps. The formula for the z-score is z = (x
µ)/σ.
If a Stooges film is chosen at random, what is the probability that it has less slaps than Goofs and
Saddles? Use the Standard Normal Probabilities Table.
(a) 50%
(b) 10
(c) 0.4880
(d) 13.35%
(e) 1.1111
21. Suppose the number of slaps per film of the Three Stooges films has distribution N(13.00, 4.50). 84%
of the films include at most how many slaps per film? Use the Standard Normal Probabilities Table.
(a) 4.50 slaps per film.
(b) 12.00 slaps per film.
(c) 9.00 slaps per film.
(d) 8.5 slaps per film.
(e) 17.5 slaps per films.
22. Suppose the number of slaps per film of the Three Stooges films has distribution N(13.00, 4.50).
What is the range of the number of slaps per films for the center 95% of the films? Use the Standard
Normal Probabilities Table or the 68-95-99.7 Rule.
(a) 4 slaps per film to 22 slaps per film.
(b) 8.5 slaps per film to 17.5 slaps per film.
(c) 4.50 slaps per film to 13.00 slaps per film.
(d) 13.00% slaps per film to 95% slaps per film.
(e) 8.5 films to 17.5 films.
23. Which of these variables is least likely to have a normal distribution?
(a) Income per person for 150 different countries.
(b) Lengths of 50 newly hatched pythons.
(c) Heights of 100 white pine trees in a forest.
(d) The weight of American males.
(e) The ACT score of 2008 ETSU freshman.
24. The scores of adults on an IQ test are approximately normal with mean 100 and standard deviation
15. Corinne scores 118 on such a test. She scores higher than what percent of all adults?
(a) About 100.
(b) About 12%.
(c) About 88%.
(d) About 09%.
(e) About 15%.
25. If women always married men who were exactly 2 years older than themselves, what would be the
correlation r between the ages of husbands and their wives?
(a) 0.00
(b) 0.50
(c) 2.00
(d)
1.00
(e) 1.00
26. You have data for many families on the parents’ income and the years of education their eldest child
completes. You expect to see:
(a) r < 0.
(b) ˆ y = mx + b.
(c) A positive association.
(d) Very little association.
(e) A negative association.
27. The points on a scatterplot lie very close to the line whose equation is y = 4
3x. The correlation
between x and y is close to:
(a) 0
(b) 4
(c)
3
(d)
1
(e) 1
ADVERTISEMENT
0 votes
Related Articles
Related forms


Related Categories
Parent category: Education