Math 1530-017 Exam 1 With Answer Key - 2009 Page 7
ADVERTISEMENT
 1
1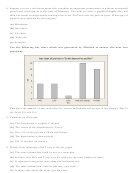 2
2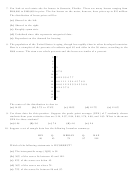 3
3 4
4 5
5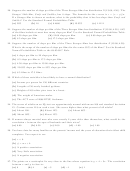 6
6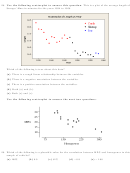 7
7 8
8 9
9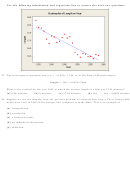 10
10 11
1128. Use the following scatterplot to answer this question. This is a plot of the average length of
Stooges’ films in minutes for the years 1934 to 1958.
Which of the following is true about this data?
(a) There is a rough linear relationship between the variables.
(b) There is a negative association between the variables.
(c) There is a positive association between the variables.
(d) Both (a) and (b).
(e) Both (a) and (c).
Use the following scatterplot to answer the next two questions.
29. Which of the following is a plausible value for the correlation between MPG and horsepower in this
sample of vehicles?
(a) 100%
(b) 0.9
(c) 81%
(d)
0.9
(e)
1.00
ADVERTISEMENT
0 votes
Related Articles
Related forms


Related Categories
Parent category: Education