Statistical Graphs, Charts, Tables, Percentages, Percentile Worksheet With Answers - Unit 2, Module 8 Page 2
ADVERTISEMENT
 1
1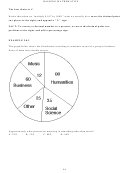 2
2 3
3 4
4 5
5 6
6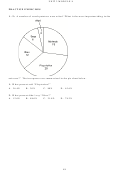 7
7 8
8 9
9 10
10HACKING MATHEMATICS
The best choice is C.
Notice that when we "multiply 0.107 by 100%" what we actually do is move the decimal point
two places to the right, and append a "%" sign.
FACT: To convert a decimal number to a percent, we move the decimal point two
positions to the right, and add a percentage sign.
EXAMPLE 2.8.2
The graph below shows the distribution according to academic major of a group of students.
None of them have double majors.
Approximately what percent are majoring in something other than music?
A. 25%
B. 12%
C. 88%
D. 94%
84
ADVERTISEMENT
0 votes
Related Articles
Related forms


Related Categories
Parent category: Education