Statistical Graphs, Charts, Tables, Percentages, Percentile Worksheet With Answers - Unit 2, Module 8 Page 3
ADVERTISEMENT
 1
1 2
2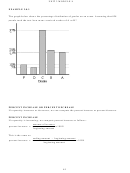 3
3 4
4 5
5 6
6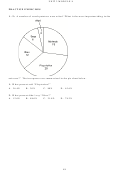 7
7 8
8 9
9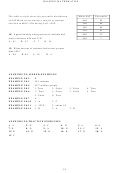 10
10UNIT 2 MODULE 8
EXAMPLE 2.8.3
The graph below shows the percentage distribution of grades on an exam. Assuming that 828
people took the test, how many received grades of A or B?
PERCENT INCREASE OR PERCENT DECREASE
If a quantity increases or decreases, we can compute the percent increase or percent decrease.
PERCENT INCREASE
If a quantity is increasing, we compute percent increase as follows:
amount of increase
percent increase =
"100%
beginning amount
This is the same as:
ending amount – beginning amount
percent increase =
"100%
!
beginning amount
!
85
ADVERTISEMENT
0 votes
Related Articles
Related forms


Related Categories
Parent category: Education