Modeling With Quadratic Functions Worksheet - Section 2.4 Page 5
ADVERTISEMENT
 1
1 2
2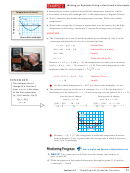 3
3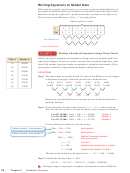 4
4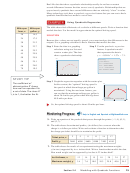 5
5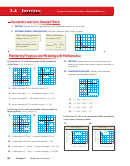 6
6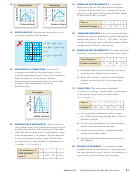 7
7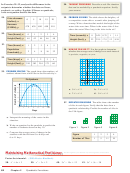 8
8Real-life data that show a quadratic relationship usually do not have constant
second differences because the data are not exactly quadratic. Relationships that are
approximately quadratic have second differences that are relatively “close” in value.
Many technology tools have a quadratic regression feature that you can use to fi nd a
quadratic function that best models a set of data.
Using Quadratic Regression
The table shows fuel effi ciencies of a vehicle at different speeds. Write a function that
Miles per
Miles per
models the data. Use the model to approximate the optimal driving speed.
hour, x
gallon, y
20
14.5
SOLUTION
24
17.5
Because the x-values are not equally spaced, you cannot analyze the differences in the
30
21.2
outputs. Use a graphing calculator to fi nd a function that models the data.
36
23.7
Step 1 Enter the data in a graphing
Step 2 Use the quadratic regression
calculator using two lists and
feature. A quadratic model
40
25.2
create a scatter plot. The data
that represents the data is
45
25.8
y = −0.014x
+ 1.37x − 7.1.
2
show a quadratic relationship.
50
25.8
35
QuadReg
56
25.1
2
y=ax
+bx+c
a=-.014097349
60
24.0
b=1.366218867
c=-7.144052413
70
19.5
2
R
=.9992475882
0
75
0
STUDY TIP
Step 3 Graph the regression equation with the scatter plot.
The coeffi cient of
35
In this context, the “optimal” driving speed is
2
determination R
shows
the speed at which the mileage per gallon is
how well an equation fi ts
maximized. Using the maximum feature, you
2
a set of data. The closer R
can see that the maximum mileage per gallon is
is to 1, the better the fi t.
about 26.4 miles per gallon when driving about
Maximum
48.9 miles per hour.
X=48.928565 Y=26.416071
0
75
0
So, the optimal driving speed is about 49 miles per hour.
Monitoring Progress
Monitoring Progress
Help in English and Spanish at
5.
Write an equation of the parabola that passes through the points (−1, 4), (0, 1),
and (2, 7).
6.
The table shows the estimated profi ts y (in dollars) for a concert when the
charge is x dollars per ticket. Write and evaluate a function to determine what
the charge per ticket should be to maximize the profi t.
Ticket price, x
2
5
8
11
14
17
Profi t, y
2600
6500
8600
8900
7400
4100
7.
The table shows the results of an experiment testing the maximum weights
y (in tons) supported by ice x inches thick. Write a function that models the data.
How much weight can be supported by ice that is 22 inches thick?
Ice thickness, x
12
14
15
18
20
24
27
Maximum weight, y
3.4
7.6
10.0
18.3
25.0
40.6
54.3
Section 2.4
Modeling with Quadratic Functions
79
ADVERTISEMENT
0 votes
Related Articles
Related forms


Related Categories
Parent category: Education