Chemistry Worksheet With Answer Key Page 2
ADVERTISEMENT
 1
1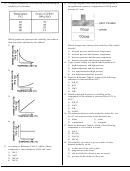 2
2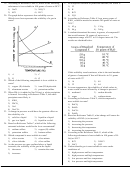 3
3 4
4 5
5 6
6 7
7 8
8 9
910. A student obtained the following data in determining the
12. Given the diagram below that shows carbon dioxide in
solubility of a substance.
an equilibrium system at a temperature of 298 K and a
pressure of 1 atm:
Which graph best represents the solubility curve drawn
from the results obtained by the student?
1)
Which changes must increase the solubility of the carbon
dioxide?
1) increase pressure and decrease temperature
2) increase pressure and increase temperature
3) decrease pressure and decrease temperature
4) decrease pressure and increase temperature
13. A gas is most soluble in a liquid under conditions of
1) high temperature and high pressure
2) high temperature and low pressure
2)
3) low temperature and high pressure
4) low temperature and low pressure
14. Based on Reference Table G, which of the following
substances is most soluble at 60ºC?
1) NH
Cl
4
2) KCl
3) NaCl
4) NH
3
15. Which compound decreases in solubility as the
3)
temperature of the solution is increased from 10ºC to
50ºC?
1) NH
Cl
4
2) NaCl
3) NH
3
4) NaNO
3
+
16. The attraction between water molecules and an Na
ion
–
or a Cl
ion occurs because water molecules are
1) linear
3) polar
4)
2) symmetrical
4) nonpolar
17. Based on Reference Table F, which of the following
compounds is least soluble in water?
1) NaCl
2) Pb
ClO
2
3
3) Na
CrO
2
4
4) PbCrO
4
18. The solubility of a salt in a given volume of water
depends primarily on the
11. According to Reference Table F, which of these
1) surface area of the salt crystals
compounds is most soluble at 298 K and 1 atm?
2) temperature of the water
1) PbCl
2
3) rate at which the salt and water are stirred
2) AgCl
4) pressure on the surface of the water
3) PbCrO
4
4) PbCO
3
ADVERTISEMENT
0 votes
Related Articles
Related forms


Related Categories
Parent category: Education