Math Exam Worksheet With Answer Key - Math 103/gracey Page 11
ADVERTISEMENT
 1
1 2
2 3
3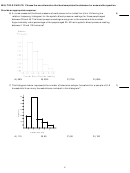 4
4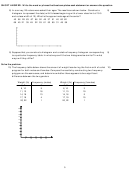 5
5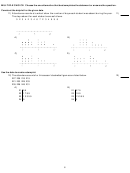 6
6 7
7 8
8 9
9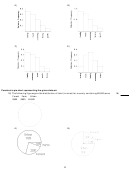 10
10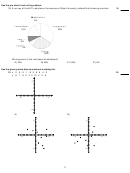 11
11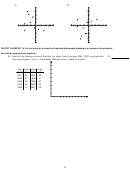 12
12 13
13 14
14 15
15 16
16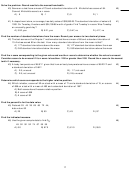 17
17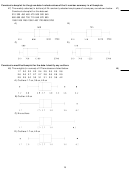 18
18 19
19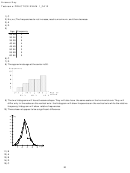 20
20 21
21 22
22Use the pie chart to solve the problem.
19) A survey of the 4571 vehicles on the campus of State University yielded the following pie chart.
19)
9%
16%
35%
8%
4%
28%
What percent of the vehicles are hatchbacks?
A) 35%
B) 28%
C) 160%
D) 8%
Use the given paired data to construct a scatterplot.
20) x -2 -8 -5 -1 -8 2 -6 6 -4 -2
20)
y -6 -1 -8 2 4 3 -10 4 -2 -6
y
y
10
10
x
x
-10
-10
10
10
-10
-10
A)
B)
y
y
y
y
10
10
10
10
x
x
x
x
-10
-10
10
10
-10
-10
10
10
-10
-10
-10
-10
11
ADVERTISEMENT
0 votes
Related Articles
Related forms


 Worksheets With Answer Key")


Related Categories
Parent category: Education