Math Exam Worksheet With Answer Key - Math 103/gracey Page 13
ADVERTISEMENT
 1
1 2
2 3
3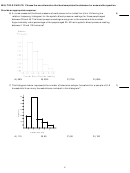 4
4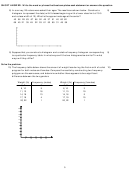 5
5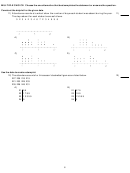 6
6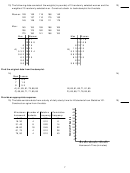 7
7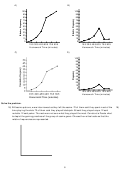 8
8 9
9 10
10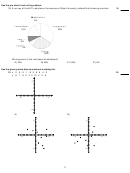 11
11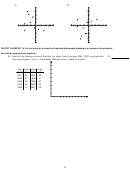 12
12 13
13 14
14 15
15 16
16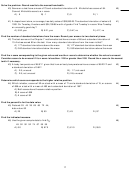 17
17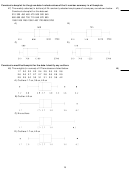 18
18 19
19 20
20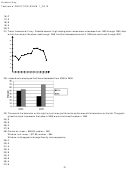 21
21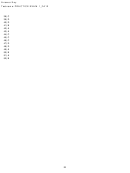 22
2222) An annual survey sent to retail store managers contained the question "Did your store
22)
suffer any losses due to employee theft?" The responses are summarized in the table for
two years, 2000 and 2005. Construct a multiple bar graph of the data, then describe any
trends.
Employee
Percentage
Percentage
Theft
in 2000
in 2005
Yes
49
32
No
51
68
Totals
100
100
23) A television manufacturer sold three times as many televisions in 2005 as it did in 1995. To
23)
illustrate this fact, the manufacturer draws a graph as shown below. The television on the
right is three times as tall and three times as wide as the television on the left. Why is this
graph misleading? What visual impression is created by the graph?
13
ADVERTISEMENT
0 votes
Related Articles
Related forms


 Worksheets With Answer Key")


Related Categories
Parent category: Education