Math Exam Worksheet With Answer Key - Math 103/gracey Page 4
ADVERTISEMENT
 1
1 2
2 3
3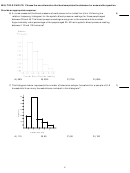 4
4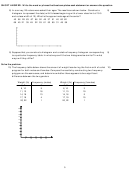 5
5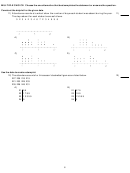 6
6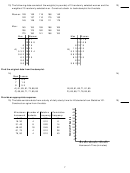 7
7 8
8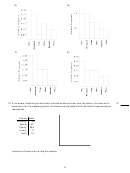 9
9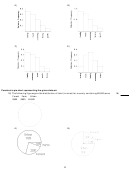 10
10 11
11 12
12 13
13 14
14 15
15 16
16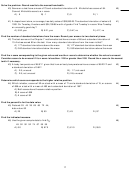 17
17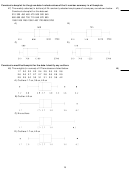 18
18 19
19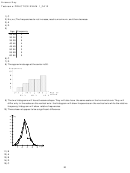 20
20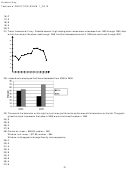 21
21 22
22MULTIPLE CHOICE. Choose the one alternative that best completes the statement or answers the question.
Provide an appropriate response.
6) A nurse measured the blood pressure of each person who visited her clinic. Following is a
6)
relative-frequency histogram for the systolic blood pressure readings for those people aged
between 25 and 40. The blood pressure readings were given to the nearest whole number.
Approximately what percentage of the people aged 25-40 had a systolic blood pressure reading
between 110 and 139 inclusive?
A) 59%
B) 39%
C) 75%
D) 89%
7) The histogram below represents the number of television sets per household for a sample of U.S.
7)
households. How many households are included in the histogram?
50
50
40
40
30
30
20
20
10
10
1
1
2
2
3
3
4
4
5
5
Number of TV Sets
Number of TV Sets
A) 110
B) 95
C) 90
D) 100
4
ADVERTISEMENT
0 votes
Related Articles
Related forms


 Worksheets With Answer Key")


Related Categories
Parent category: Education