Chapter 11 Probability Worksheet Page 5
ADVERTISEMENT
 1
1 2
2 3
3 4
4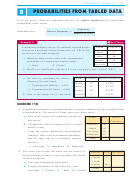 5
5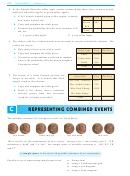 6
6 7
7 8
8 9
9 10
10 11
11 12
12 13
13 14
14 15
15 16
16 17
17 18
18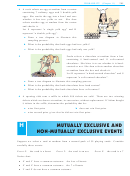 19
19 20
20 21
21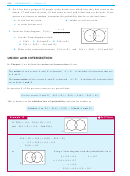 22
22 23
23 24
24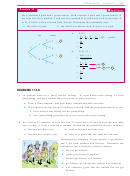 25
25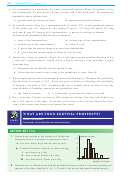 26
26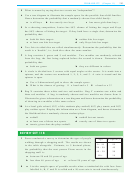 27
27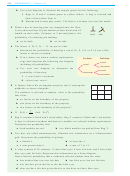 28
28271
PROBABILITY (Chapter 11)
B
PROBABILITIES FROM TABLED DATA
If we are given a table of frequencies then we use relative frequencies to estimate the
probabilities of the events.
frequency
relative frequency =
Remember that:
number of trials
Example 2
Self Tutor
A marketing company surveys 80 randomly selected people
Brand
Frequency
to discover what brand of shoe cleaner they use. The results
27
Shine
are shown in the table alongside:
22
Brite
a
Based on these results, what is the experimental
20
Cleano
probability of a community member using:
11
No scuff
i
ii
Brite
Cleano?
b
Would you classify the estimate of
a
to be very good, good, or poor? Why?
a
We start by calculating the relative
Brand
Frequency Relative Frequency
frequency for each brand.
27
0:3375
Shine
Experimental P(Brite) = 0:275
i
22
0:2750
Brite
Experimental P(Cleano) = 0:250
ii
20
0:2500
Cleano
b
Poor, as the sample size is very small.
11
0:1375
No scuff
EXERCISE 11B
1
A marketing company was commissioned to investigate brands of products usually found
in the bathroom. The results of a soap survey are given below:
a
How many people were randomly selected in
Brand
Freq
Relative
this survey?
Frequency
125
b
Calculate the relative frequency of use of each
Silktouch
107
brand of soap.
Super
93
Just Soap
c
Using the results obtained by the marketing
82
Indulgence
company, what is the experimental probability
Total
that the soap used by a randomly selected
person is:
i
ii
iii
Just Soap
Indulgence
Silktouch?
Two coins were tossed 489 times and the number of
2
Outcome
Freq
Rel Freq
heads occurring at each toss was recorded. The results
0 heads
121
are shown opposite:
1 head
a
Copy and complete the table given.
2 heads
109
b
Estimate the chance of the following events
Total
0 heads
1 head
2 heads.
occurring:
i
ii
iii
ADVERTISEMENT
0 votes
Related Articles
Related forms


Related Categories
Parent category: Education