Summative Assessment-I Mcq Math Worksheets And Practice Questions - Class Vi - 2014-2015 Page 40
ADVERTISEMENT
 1
1 2
2 3
3 4
4 5
5 6
6 7
7 8
8 9
9 10
10 11
11 12
12 13
13 14
14 15
15 16
16 17
17 18
18 19
19 20
20 21
21 22
22 23
23 24
24 25
25 26
26 27
27 28
28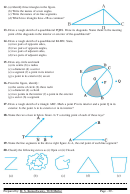 29
29 30
30 31
31 32
32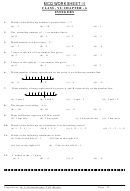 33
33 34
34 35
35 36
36 37
37 38
38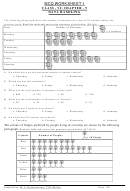 39
39 40
40 41
41 42
42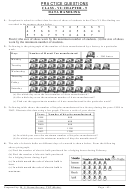 43
43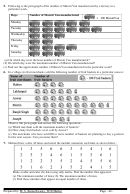 44
44 45
45 46
467. Find the number of people preferring blue colour.
a. 20
b. 80
c. 50
d. 10
8.
How many people liked red colour?
a. 120
b. 80
c. 50
d. 110
9. Find the number of people preferring white colour.
a. 20
b. 80
c. 50
d. 10
10. Which colour preferred most?
a. red
b. blue
c. yellow
d. black
11. Which colour preferred least?
a. green
b. white
c. yellow
d. black
12. Which two colours liked by same number of people?
a. green and red
b. white and yellow
c. green and black
d. black and red
13. Find the number of people preferring yellow colour.
a. 20
b. 80
c. 50
d. 60
14.
A data is a collection of numbers gathered to give some information.
a. bar graph
b. data
c. frequency
d. tally mark
15. The tally mark
frequency _______________
a. 6
b. 5
c. 10
d. 8
Prepared by: M. S. KumarSwamy, TGT(Maths)
Page - 40 -
ADVERTISEMENT
0 votes
Related Articles
Related forms

 - Math Worksheet With Answer Key")
 - Math Worksheet With Answer Key")
 - Math Worksheet With Answer Key")
 - Math Worksheet With Answer Key")
 - Math Worksheet With Answer Key")
 - Math Worksheet With Answer Key")
 - Math Worksheet With Answer Key")
 - Math Worksheet With Answer Key")
 - Math Worksheet With Answer Key")
Related Categories
Parent category: Education