Summative Assessment-I Mcq Math Worksheets And Practice Questions - Class Vi - 2014-2015 Page 41
ADVERTISEMENT
 1
1 2
2 3
3 4
4 5
5 6
6 7
7 8
8 9
9 10
10 11
11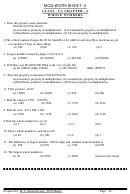 12
12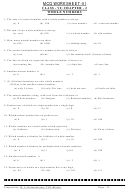 13
13 14
14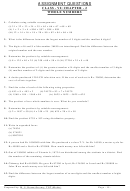 15
15 16
16 17
17 18
18 19
19 20
20 21
21 22
22 23
23 24
24 25
25 26
26 27
27 28
28 29
29 30
30 31
31 32
32 33
33 34
34 35
35 36
36 37
37 38
38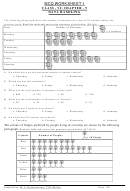 39
39 40
40 41
41 42
42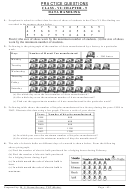 43
43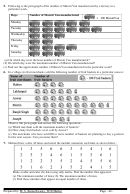 44
44 45
45 46
46MCQ WORKSHEET-II
CLASS - VI: CHAPTER - 9
DATA HANDLING
1. In a bar graph bars are made __________
a. Horizontally
b. vertically
c. sometime horizontally some time vertically
d. oblique
2. Representation of data in the form of picture ism called ______________
a. bar graph
b. pictograph
c. histogram
d. none of these
3. In a bar graph space between rectangles is always __________________
a. Unequal
b. increasing
c. decreasing
d. equal
4. The tally mark
frequency _______________
a. 6
b. 5
c. 0
d. 4
5. In a bar graph the width of the rectangle is
a. Unequal
b. increasing c. decreasing
d. equal
Following table shows the number of bicycles manufactured in a factory during the year 1998 to
2002. Read the table and answer the questions given bellow (Q7-Q12)
Years
No.of bicycles manufactured
1998
800
1999
600
2000
900
2001
1100
2002
1200
6. In which year were the maximum number of bicycles manufactured ?
a. 2002
b. 2001
c. 2000
d. 1999
7. In which year were the minimum number of bicycles manufactured ?
a. 2002
b. 1999
c. 2000
d. 1998
8. How many bicycles were manufactured from 1998 to 2002?
a. 4600
b. 4000
c. 2400
d. 2800
9. What is the difference between number of bicycles manufactured in 2002 and 1999 ?
a. 600
b. 1200
c. 500
d. 1800
10. How many bicycles were manufactured from 1998 to 2000?
a. 2300
b. 2000
c. 2400
d. 2800
11. In which year were the difference is more manufactured ?
a. 2002
b. 1999
c. 2000
d. 1998
12. On which year did the number of bicycles differ the most from the preceeding year?
a. 2002
b. 1999
c. 2000
d. 1998
Prepared by: M. S. KumarSwamy, TGT(Maths)
Page - 41 -
ADVERTISEMENT
0 votes
Related Articles
Related forms

 - Math Worksheet With Answer Key")
 - Math Worksheet With Answer Key")
 - Math Worksheet With Answer Key")
 - Math Worksheet With Answer Key")
 - Math Worksheet With Answer Key")
 - Math Worksheet With Answer Key")
 - Math Worksheet With Answer Key")
 - Math Worksheet With Answer Key")
 - Math Worksheet With Answer Key")
Related Categories
Parent category: Education