Graphing Linear Equations And Functions Worksheet - Welcome To Algebra 1: Concepts And Skills Page 2
ADVERTISEMENT
 1
1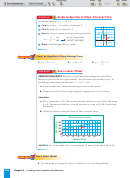 2
2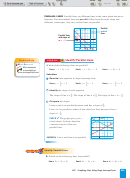 3
3 4
4 5
5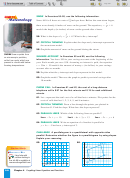 6
6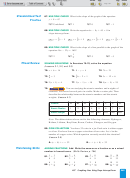 7
7Page 2 of 7
Graph an Equation in Slope-Intercept Form
2
EXAMPLE
Graph the equation y
3x
2.
Find
the slope,
3, and the y-intercept, 2.
y
Plot
the point (0, b) when b is 2.
1
(0, 2)
the slope to locate a second point on the line.
Use
3
r
i
s
e
m
o
v
e
3
u
n
it
s
d
o
w
n
3
m
1
r
u
n
m
o
v
e
1
u
n
i
t r
i
g
ht
1
3
x
1
Draw
a line through the two points.
Graph an Equation in Slope-Intercept Form
2
y
2x
3
y
4x
5
y
x
2
1.
2.
3.
3
Use a Linear Model
3
EXAMPLE
Chai has a small business making decorated hats.
PRODUCTION COSTS
Based on data for the last eight months, she calculates her monthly cost y of
producing x hats using the function y
1.9x
350.
Explain what the y-intercept and slope mean in this model.
a.
b.
Graph the model. Then use the graph to estimate the cost of 35 hats.
Solution
a.
The y-intercept is 350. This means that her initial cost was $350. The slope
is 1.9. This means that her cost will increase at a rate of $1.90 for each hat
she makes.
b.
Graph the line by using the slope to find a second point.
Hat Production Costs
y
450
(35, 416.5)
400
66.5
350
35
(0, 350)
300
0
x
0
10
20
30
40
50
60
Number of hats
From the graph, the cost of making 35 hats will be about $416.50.
ANSWER
Use a Linear Model
4.
Use the graph in Example 3 above to find the cost of making 60 hats.
244
Chapter 4 Graphing Linear Equations and Functions
ADVERTISEMENT
0 votes
Related Articles
Related forms


Related Categories
Parent category: Education