Saturday X-Tra Representing And Reading Data Sheet - Mindset Learn Page 9
ADVERTISEMENT
 1
1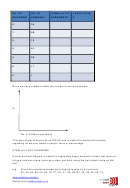 2
2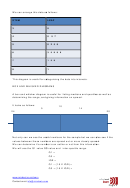 3
3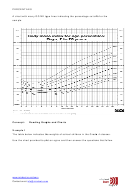 4
4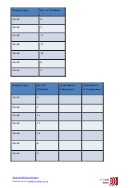 5
5 6
6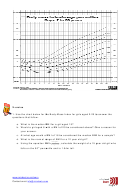 7
7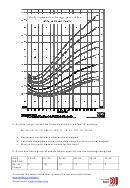 8
8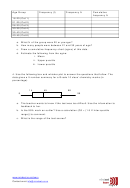 9
9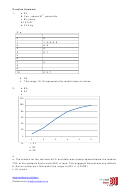 10
10Age Group
Frequency (f)
Frequency %
Cumulative
frequency %
16-20 (Cat 1)
21-25 (Cat 2)
26-30 (Cat 3)
30-35 (Cat 4)
35-40 (Cat 5)
40-45 (Cat 6)
a. What % of the group were 20 or younger?
b. How many people were between 21 and 30 years of age?
c. Draw a cumulative frequency chart (ogive) of this data.
d. Estimate the following from the ogive:
i. Mean
ii. Upper quartile
iii. Lower quartile
4. Use the following box and whisker plot to answer the questions that follow. The
data gives a 5 number summary for a Grade 10 class’ chemistry marks (in
percentage).
14
45
68
8
99
a. The teacher wants to know if the test was too difficult. Use the information to
feedback to her.
b. Is the 99% mark an outlier? Use a calculation (Q3 + (1.5 X Inter-quartile
range)) to comment.
c. What is the range of the test scores?
Contact us at:
info@mindset.co.za
Page 9
ADVERTISEMENT
0 votes
Related Articles
Related forms


Related Categories
Parent category: Education