Data Analysis Worksheet Page 2
ADVERTISEMENT
 1
1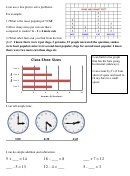 2
2I can use a line plot to solve problems.
For example:
1) What is the most popular pet? CAT
2) How many more pet cats are there,
compared to snakes? 6 – 2 = 4 more cats
3) What other facts can you find from the line
plot? I know there were 4 pet dogs, 3 pet mice, 15 people answered the question, snakes
were least popular, mice were second least popular, dogs for second most popular. I know
there were two more cats than dogs etc.
I can build a bar graph
Class Shoe Sizes
that has the bars going
horizontal (sideways).
Size 5
I can count by 2’s if I am
Size 4
short of space and need to
fit my bars in a small
Size 3
space.
Size 2
0
2
4
6
8
10
Number Of Students
I can tell simple time.
3:00
4:30
2:45
I can do simple addition and subtraction.
18 – ___ = 8
5 + ___ = 14
___ + 7 = 12
12 – 4 = ___
___ - 5 = 13
5 - ___ = 3
ADVERTISEMENT
0 votes
Related Articles
Related forms


Related Categories
Parent category: Education