5.6 Analyzing Data Sets Examples And Worksheet - Chapter 5: Ratios, Rates, And Data Analysis
ADVERTISEMENT
 1
1 2
2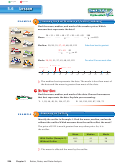 3
3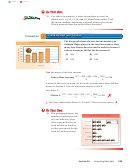 4
4 5
5 6
6English
Spanish
Analyzing Data Sets
5.6
How can you use tables and graphs to help
STATE
S
organize data?
STANDARDS
MA.6.S.6.2
1 1
ACTIVITY:
Conducting an Experiment
Work with a partner.
Tally Chart
a. Roll a number cube 20 times.
1
Record your results in a tally chart.
2
b. Make a bar graph of the totals.
3
c. Go to the board and enter your
4
totals in the class tally chart.
5
d. Make a second bar graph showing
6
the class totals. Compare and
∣
contrast the two bar graphs.
̇
∣
= 1
∣
∣
∣
∣
= 5
̇
̇
̇
̇
̇
Key:
̇
̇
̇
̇
̇
̇
2 2
ACTIVITY:
Organizing Data
Work with a partner. You are judging a paper airplane contest. Each
contestant fl ies his or her paper airplane 20 times. Make a tally chart
and a graph of the distances.
Sample:
20.5 ft, 24.5 ft, 18.5 ft, 19.5 ft, 21.0 ft, 14.0 ft, 12.5 ft, 20.5 ft, 17.5 ft, 24.5 ft,
19.5 ft, 17.0 ft, 18.5 ft, 12.0 ft, 21.5 ft, 23.0 ft, 13.5 ft, 19.0 ft, 22.5 ft, 19.0 ft
Tally Chart
Paper Airplane Contest
Interval
Tally
Total
9
∣
∣
̇
̇
8
10.0−12.9
2
̇
̇
7
∣
∣
̇
̇
13.0−15.9
2
̇
̇
6
∣
∣
∣
∣
̇
̇
̇
̇
16.0−18.9
4
∣
5
̇
̇
̇
̇
̇
∣
∣
∣
∣
∣
∣
∣
̇
̇
̇
̇
̇
̇
̇
4
19.0−21.9
8
̇
̇
̇
̇
̇
̇
̇
̇
3
∣
∣
∣
∣
̇
̇
̇
̇
22.0−24.9
4
̇
̇
̇
̇
2
1
a. Make a different tally chart and
0
graph of the distances using the
following intervals.
Interval
10.0–11.9, 12.0–13.9, 14.0–15.9,
16.0–17.9, 18.0–19.9, 20.0–21.9,
22.0–23.9, 24.0–25.9
b. Which graph do you think represents the distances better? Explain.
222
Chapter 5
Ratios, Rates, and Data Analysis
ADVERTISEMENT
0 votes
Related Articles
Related forms


Related Categories
Parent category: Education