Uk Boys 2-20 Yr Childhood And Puberty Close Monitoring (Cpcm) Growth Chart Page 2
ADVERTISEMENT
 Growth Chart Printable pdf") 1
1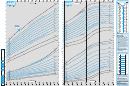 2
2160cm
160cm
210cm
210cm
3
1
/
4
4
1
/
5
5
1
/
6
6
1
/
7
7
1
/
8
8
1
/
9
11
12
13
14
15
16
17
18
19
20
Parent height comparator
2
2
2
2
2
2
BOYS
BOYS
205
205
M
t o
e h
s ’ r
s
Age in years
Age in years
e h
g i
t h
t a
e h
s ’ r
155
2-9 years
155
9-20 years
t f
n i /
m c
e h
g i
t h
200
200
6
” 1 ’
1
5 8
t f
n i /
m c
6
” 7 ’
2
0 0
Mid-parental
M
d i
p -
r a
n e
l a t
’ 6
2
1
/
3
10
2
centile
e c
t n
e l i
6
” 6 ’
195
195
months
150
150
’ 5
” 1 1
1
0 8
91st
1 9
t s
6
" 5 ’
1
5 9
190
190
’ 5
” 0 1
6
4 6
” 4 ’
145
145
5
” 9 ’
1
5 7
6
" 3 ’
9 1
0
185
185
6
" 2 ’
5
” 8 ’
75th
5 7
h t
180
180
1
5 8
6
" 1 ’
1
0 7
5
” 7 ’
140
140
’ 6
5
” 6 ’
175
175
8 1
0
’ 5
” 1 1
5
” 5 ’
1
5 6
’ 5
” 0 1
50th
0 5
h t
135
135
170
170
5
” 4 ’
1
5 7
5
5
” 9 ’
1
1
0 6
0 6
5
5
” 3 ’
” 3 ’
165
165
5
” 8 ’
130
130
1
0 7
5
” 2 ’
5
” 7 ’
160
160
25th
5 2
h t
review
1
5 5
5
” 6 ’
5
” 1 ’
months
1
5 6
5
5
” 5 ’
155
155
’ 5
125
125
Transit point
5
” 4 ’
1
0 5
’ 4
” 1 1
from UK-WHO
150
-4 SD
150
1
0 6
5
” 3 ’
to UK90 data.
9th
9
h t
’ 4
” 0 1
120
120
5
” 2 ’
145
145
1
5 4
4
” 9 ’
1
5 5
5
5
” 1 ’
4
” 8 ’
’ 5
140
140
115
115
1
0 4
1
0 5
0
4
” 7 ’
’ 4
” 1 1
135
135cm
Father’ height:____________
110
110
130
120kg
Mother’ height:___________
Mid-parental centile
125
115
• Plot the mother’s and father’s
105
105
heights on their respective
scales and join the two points
120
110
with a line. The mid-parental
centile is where this line
100
100cm
115
105
crosses the centile line in the
middle.
• Compare the mid-parental
110
100
centile to the child’s current
height centile, plotted on the
95
55kg
adult height predictor centile
105
95
scale.
• Nine out of ten children’s
Birth
100cm
90
height centiles are within ±2
90
2
50
centiles
centile spaces of the mid-
parental centile.
85kg
85
dult height predictor
85
45
80
80
ft/in
cm
99.6th
192
75
75
6’3”
190
80
40
98th
6’2”
Length
70
70
6’1”
91st
185
58
99 6th
75
35
65
65
6’0”
56
75th
98th
5’11”
180
91st
54
60
60
50th
5’10”
75th
70cm
30
52
50th
55
55
5’9”
175
25th
50
25th
5’8”
48
9th
50
50
25kg
9th
25
5’7”
170
2nd
46
5’6”
45
45
2nd
0 4th
44cm
5’5”
165
20
20
0.4th
40
40
Weight
5’4”
5’3”
160
5
35
35
99 6th
15
15
Predicted adult height
98th
4.5
30
30
• Plot the most recent height
91st
4
centile on the relevant centile
75th
10
line.
10
50th
3.5
25
25
• Read off the predicted adult
25th
height for this centile.
3
• Four out of five children will
9th
20
20
Age in years
Age in years
be within ±6 cm of this value.
5
2nd
2.5
5
Cole TJ, Wright CM. 2011. A chart to predict adult
0 4th
2
/
3
/
4
/
5
/
6
/
7
/
8
/
9
15
10
11
12
13
14
15
16
17
18
19
20
15
height from a child's current height. Ann Hum Biol.
2
1
3
1
4
1
5
1
6
1
7
1
8
1
2kg
2
2
2
2
2
2
2
2011;38:662-8.
9
Wright C, Cheetham T. The strengths and
limitations of parental heights as a predictor of
1
0kg
0kg
10kg
10kg
attained height. Arch Dis Child 1999; 81(2):257-60
ADVERTISEMENT
0 votes
Related Articles
Related forms
 Growth Chart")


")
")

Related Categories
Parent category: Medical