Shedding Light On Energy Lesson Plan Page 2
ADVERTISEMENT
 1
1 2
2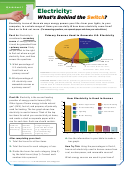 3
3 4
4Welcome Teachers!
Student Interactive Site:
We’re pleased to present you with Shedding Light on Energy, the fi rst of three
poster/teaching guides designed to bring students the basic facts about energy,
Includes: • Nationwide Energy
while also building real-world skills to help them think critically and make decisions.
Contest for Students
This series, aligned with national standards in science, math, and social studies,
launches with this poster/teaching guide focused on graphing skills and key facts
• Energy Activities,
about energy sources and uses. The next two poster/teaching guides, coming
Fun Facts, and Games
in January and April 2011, will cover such topics as new and emerging energy
• Interactive U.S.
technologies, as well as the story of how energy is transported to our homes and
Energy Map
communities.
Visit
to fi nd a dynamic interactive student site,
as well as a nationwide energy contest for students with great prizes.
We hope these materials will empower your students to join the national conversation
about America’s energy future, and provide critical-thinking skills to last a lifetime.
Look for the next two posters coming soon!
Sincerely,
Karen Alderman Harbert
Ann Amstutz Hayes
President and CEO
Vice President and Group Publisher
Institute for 21st Century Energy, U.S. Chamber of Commerce
Scholastic Inc.
FOR TEACHERS: Find additional background, a
national standards matrix, and printable copies of this
program at:
FOR STUDENTS: Find energy information,
activities, and contest details at the interactive
Lesson Plan
site
Objectives: Students will understand:
3. Display the poster, which features a
6. Optional: Assign students to research
pie chart of total energy consumption
additional facts related to energy at
• the major U.S. energy sources and
.
(by source) in the United States.
how they are used, with a focus on
Review why a pie chart is used to
Discuss why some sources are better
residential and transportation uses
display the information. Review
suited for certain applications (e.g.,
• when to use diff erent types of graphs
how the parts are depicted as
wind power is suitable for generating
to display information
wedges proportionate in size to
electricity, but not as fuel).
Standards Alignment: Science, Math,
the percentage they represent.
Wrap-up questions:
Social Studies
4. Next review facts about U.S. sources
• What are some key facts you
Time: 40 minutes, plus additional
of energy as listed on the poster.
learned about energy?
time for worksheets/discussion
Challenge students to come up with
• What do you think could happen
Materials: Poster; worksheets 1 and 2;
fact(s) they already know about
if one of our energy sources was
electric-powered (plug-in) classroom
each of these energy sources.
suddenly unavailable (e.g., power
items, e.g., pencil sharpener
plant maintenance, government
5. Distribute Worksheet 1 (“Electricity”)
Conducting the Lesson:
curb on production, etc.)?
and Worksheet 2 (“Transportation”).
Have students work individually,
• Do you think the graphs used
1. Before hanging up the poster, make
but discuss answers as a class.
in the worksheets were the
copies of the lesson and worksheets.
Review with students, as necessary,
appropriate types of graphs
Prior to conducting the lesson, review
the diff erences between pie
to use for the information
all the lesson steps as well as the
charts and bar graphs.
displayed, and why?
types of graphs on the worksheets,
and how they are used. Find
additional teacher resources at www.
ANSWER KEY: Worksheet 1 Part A: 1. Coal (44.6%) + Natural Gas (23.3%) + Petroleum (1%) + Other
Gases (.3%) = 69.2%. 2. Hydroelectric (6.8%) + Other Renewables (3.6%) = 10.4%. Part B: Answers will
vary depending upon the uses listed by the student. However, the sum of the category percentages on
2. Show students an electric-powered
the graph should equal 100%. Now Try This: Coal: .41 x .446 = .18 (18%); nuclear power: .41 x .202 = .08
plug-in item and ask how it gets its
(8%); renewable sources: .41 x .104 = .04 (4%). Worksheet 2 Part A: 1. Transportation: Diesel (23.0%) +
power. Once they establish that it is
Gasoline (41.5%) + Jet Fuel (9.1%) = 73.6%. Purposes besides transportation: Other Products (15.7%) +
Liquefi ed Petroleum Gases (3.8%) + Other Distillates (3.1%) + Heavy Fuel Oil (3.8%) = 26.4% 2. Answers
powered by electricity, ask where the
can vary, and can include any plastic-based item, and items such as crayons, bubble gum, deodorant,
electricity comes from. Distinguish
clothes, eyeglasses, CDs and DVDs, tires, and ammonia. Part B: 1. 404 million barrels (Texas) + 236
responses between uses (e.g.,
million barrels (Alaska) = 640 million barrels ÷ 1,957 million barrels (Total U.S.) = 33%. 2. 1,957 million
lighting, appliances, etc.), sources
barrels (U.S. Production) + 3,290 million barrels (Total Imports) = 5,247 million barrels. U.S. production
(e.g., petroleum, coal, electricity,
percentage of the total = 1,957 million barrels ÷ 5,247 million barrels = 37%. Import percentage of
the total = 3,290 million barrels ÷ 5,247 million barrels = 63%. Total from North American countries:
etc.), and electricity infrastructure
709 million barrels (Canada) + 398 million barrels (Mexico) + 1,957 million barrels (U.S.) = 3,064 million
(e.g., sockets, cords, power lines).
barrels ÷ 5,247 million barrels = 58%.
ADVERTISEMENT
0 votes
Related Articles
Related forms


Related Categories
Parent category: Education