Scatter Plots And Lines Of Best Fit Worksheet
ADVERTISEMENT
 1
1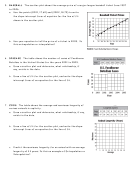 2
2Name ________________________________________Hour_____ Date________
Scatter Plots and Lines of Best Fit Worksheet
1. MUSIC The scatter plot shows the number of CDs (in millions) that
were sold from 1999 to 2005. If the trend continued, about how
many CDs were sold in 2006?
2. FAMILY The table below shows the predicted annual cost for
a middle income family to raise a child from birth until
adulthood. Draw a scatter plot and describe what relationship
exists within the data.
3. Make a scatter plot of the data in the table. Draw a line of best fit.
What is the equation of the line of best fit?
X
-2
-2
-1
0
1
1
1
2
2
3
Y
2
3
2
1
0
1
-1
-1
-2
-2
4. EDUCATION The table at the right gives
Study Hours
3
2
5
1
0
4
3
the number of hours spent studying for a
Grade
84
77
92
70
60
90
75
science exam and the final exam grade.
a. Draw a scatter plot of the data and draw in the line of best fit.
b. What is the equation for the line of best fit?
c. Predict the grade for a student who studied for 6 hours.
d. Could this line go on forever? Why or why not?
ADVERTISEMENT
0 votes
Related Articles
Related forms


Related Categories
Parent category: Education