Creating Tables And Graphs Of Ratios - Ratio Worksheet With Answers
ADVERTISEMENT
 1
1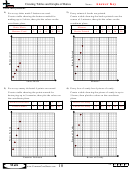 2
2Creating Tables and Graphs of Ratios
Name:
Solve each problem.
1) For every shirts made 2 buttons are used.
2) Every minute 4 books are printed.
Create a table showing the buttons needed for
Create a table showing the books printed over the
making up to 5 shirts, then plot the values on the
course of 5 minutes, then plot the values on the
coordinate plane.
coordinate plane.
Shirts Made
1
2
3
4
5
Minutes
1
2
3
4
5
Buttons Used
2
4
6
8
10
Books Printed
4
8
12
16
20
Shirts Made
Minutes
3) For every enemy defeated 4 points are earned.
4) Every box of candy has 6 pieces of candy.
Create a table showing the points earned for
Create a table showing the pieces of candy in up to
destroying up to 5 enemies, then plot the values on
5 boxes, then plot the values on the coordinate
the coordinate plane.
plane.
Enemies Defeated
1
2
3
4
5
Boxes of Candy
1
2
3
4
5
Points Earned
4
8
12
16
20
Pieces of Candy
6
12
18
24
30
Enemies Defeated
Boxes of Candy
1-4
75 50 25 0
10
Math
ADVERTISEMENT
0 votes
Related Articles
Related forms


Related Categories
Parent category: Education