Operational Plan And Budget Template Page 32
ADVERTISEMENT
 1
1 2
2 3
3 4
4 5
5 6
6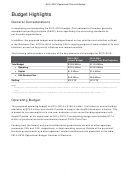 7
7 8
8 9
9 10
10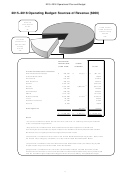 11
11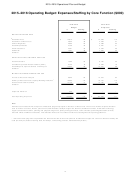 12
12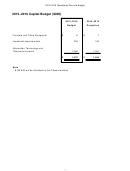 13
13 14
14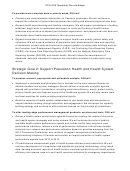 15
15 16
16 17
17 18
18 19
19 20
20 21
21 22
22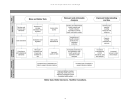 23
23 24
24 25
25 26
26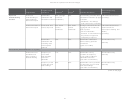 27
27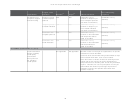 28
28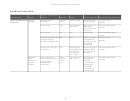 29
29 30
30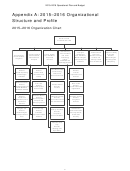 31
31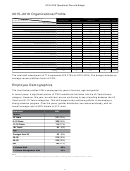 32
32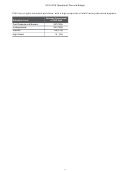 33
33 34
342015–2016 Operational Plan and Budget
2015–2016 Organizational Profile
Staff Categories
Executive/Senior
Professional/Senior
Corporate Branches
Management
Managers
Technical
Support Staff
Total
Executive Offices
5
0
0
5
10
Clinical Data Standards and Quality
1
3
33
5
42
Health System Performance
1
3
25
6
35
Health System Analysis and Emerging Issues
1
3
22
5
31
Canadian Population Health Initiative
1
1
10
5
17
Health Spending and Strategic Initiatives
1
3
27
10
41
Pharmaceuticals and Health Workforce Information Services
1
4
36
16
57
Methodologies and Specialized Care
1
4
50
13
68
Acute and Ambulatory Care Information Services
1
4
40
17
62
Health Information Applications
1
3
42
3
49
Integration Services
1
3
35
10
49
Central Operations and Services
1
5
41
25
72
Information Security
1
0
1
1
3
Privacy and General Counsel
1
0
7
1
9
Finance
1
1
10
5
17
Human Resources and Administration
1
3
19
25
48
Corporate Communications
1
1
7
3
12
Strategy and Operations
1
3
30
11
45
Western Region and Developmental Initiatives
1
5
4
1
11
Ontario, Quebec and Primary Health Care Information
1
2
8
5
16
Atlantic Region and Integrated eReporting
1
4
13
2
20
Total
25
55
460
174
714
The total staff complement of 714 represents 675 FTEs for 2015–2016. The budget includes an
average vacancy/attrition factor of 5.5%.
Employee Demographics
The chart below profiles CIHI’s employees by years of service, age and gender.
In recent years, a significant portion of CIHI’s workforce has fallen into the ≤5 Years tenure
category. However, this year, as with last, we are continuing to see a levelling between the ≤5
Years and 6–10 Years categories. This shift supports the continuing efforts in developing a
strong retention program. Over the years, gender distribution has remained steady, with an
overall average ratio of 69% female to 31% male.
Total Staff
690*
Tenure
≤5 Years
221 (32%)
6–10 Years
309 (45%)
11–15 Years
114 (17%)
16+ Years
46 (6%)
Age
Younger than 30
42 (6%)
30–39
219 (32%)
40–49
243 (35%)
50+
186 (27%)
% Female Staff
69%
% Female Management Staff
62%
Note
*
Number represents permanent employees and excludes contract staff as of November 21, 2014.
32
ADVERTISEMENT
0 votes
Related Articles
Related forms


 Plan For Project Template")


Related Categories
Parent category: Business