Financial Statement Analysis Page 8
ADVERTISEMENT
 1
1 2
2 3
3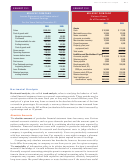 4
4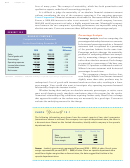 5
5 6
6 7
7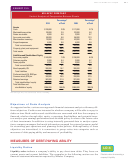 8
8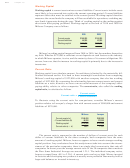 9
9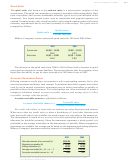 10
10 11
11 12
12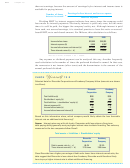 13
13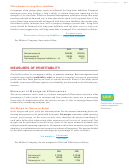 14
14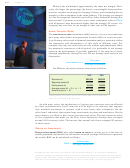 15
15 16
16 17
17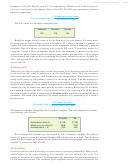 18
18 19
19 20
20 21
21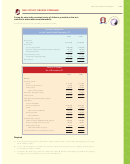 22
22 23
23 24
24 25
25 26
26 27
27 28
28 29
29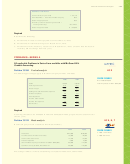 30
30 31
31 32
32 33
33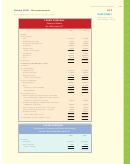 34
34 35
35 36
36 37
37 38
38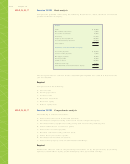 39
39 40
40 41
41 42
42 43
43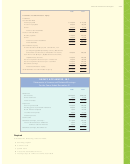 44
44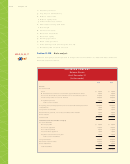 45
45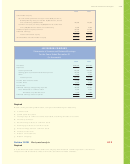 46
46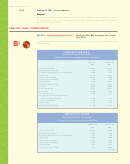 47
47 48
48 49
49 50
50Financial Statement Analysis
681
EXHIBIT 13.5
MILAVEC COMPANY
Vertical Analysis of Comparative Balance Sheets
Percentage*
Percentage*
2010
of Total
2009
of Total
Assets
Cash
$ 20,000
3.9%
$ 17,000
3.7%
Marketable securities
20,000
3.9
22,000
4.8
Notes receivable
4,000
0.8
3,000
0.7
Accounts receivable
50,000
9.8
56,000
12.3
Merchandise inventory
70,000
13.8
43,000
9.5
Prepaid expenses
4,000
0.8
4,000
0.9
Total current assets
168,000
33.1
145,000
31.9
Property, plant, and equipment
340,000
66.9
310,000
68.1
Total assets
$508,000
100.0%
$455,000
100.0%
Liabilities and Stockholders’ Equity
Accounts payable
$ 40,000
7.9%
$ 38,000
8.4%
Salaries payable
2,000
0.4
3,000
0.7
Taxes payable
4,000
0.8
2,000
0.4
Total current liabilities
46,000
9.1
43,000
9.5
Bonds payable, 8%
100,000
19.7
100,000
22.0
Total liabilities
146,000
28.7
143,000
31.4
Preferred stock 6%, $100 par
50,000
9.8
50,000
11.0
Common stock, $10 par
150,000
29.5
125,000
27.5
Retained earnings
162,000
31.9
137,000
30.1
Total stockholders’ equity
362,000
71.3
312,000
68.6
Total liabilities and
stockholders’ equity
$508,000
100.0%
$455,000
100.0%
*Percentages may not add exactly due to rounding.
Objectives of Ratio Analysis
As suggested earlier, various users approach financial statement analysis with many dif-
ferent objectives. Creditors are interested in whether a company will be able to repay its
debts on time. Both creditors and stockholders are concerned with how the company is
financed, whether through debt, equity, or earnings. Stockholders and potential inves-
tors analyze past earnings performance and dividend policy for clues to the future value
of their investments. In addition to using internally generated data to analyze opera-
tions, company managers find much information prepared for external purposes useful
for examining past operations and planning future policies. Although many of these
objectives are interrelated, it is convenient to group ratios into categories such as
measures of debt-paying ability and measures of profitability.
MEASURES OF DEBT-PAYING ABILITY
Liquidity Ratios
LO 4
Liquidity ratios indicate a company’s ability to pay short-term debts. They focus on
current assets and current liabilities. The examples in the following section use the
Calculate ratios for assessing a
financial statement information reported by Milavec Company.
company’s liquidity.
ADVERTISEMENT
0 votes
Related Articles
Related forms


Related Categories
Parent category: Financial