Financial Statement Analysis Page 9
ADVERTISEMENT
 1
1 2
2 3
3 4
4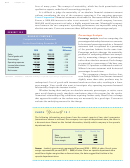 5
5 6
6 7
7 8
8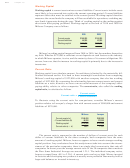 9
9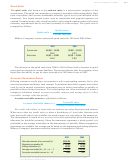 10
10 11
11 12
12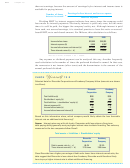 13
13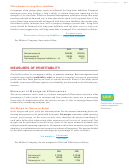 14
14 15
15 16
16 17
17 18
18 19
19 20
20 21
21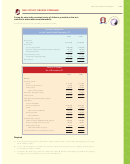 22
22 23
23 24
24 25
25 26
26 27
27 28
28 29
29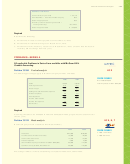 30
30 31
31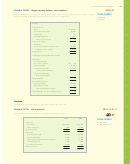 32
32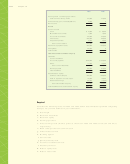 33
33 34
34 35
35 36
36 37
37 38
38 39
39 40
40 41
41 42
42 43
43 44
44 45
45 46
46 47
47 48
48 49
49 50
50682
Chapter 13
Working Capital
Working capital is current assets minus current liabilities. Current assets include assets
most likely to be converted into cash in the current operating period. Current liabilities
represent debts that must be satisfied in the current period. Working capital therefore
measures the excess funds the company will have available for operations, excluding any
new funds it generates during the year. Think of working capital as the cushion against
short-term debt-paying problems. Working capital at the end of 2010 and 2009 for
Milavec Company was as follows.
2010
2009
Current assets
$168,000
$145,000
2 Current liabilities
46,000
43,000
Working capital
$122,000
$102,000
Milavec’s working capital increased from 2009 to 2010, but the numbers themselves
say little. Whether $122,000 is sufficient or not depends on such factors as the industry
in which Milavec operates, its size, and the maturity dates of its current obligations. We
can see, however, that the increase in working capital is primarily due to the increase in
inventories.
Current Ratio
Working capital is an absolute amount. Its usefulness is limited by the materiality dif-
ficulties discussed earlier. It is hard to draw meaningful conclusions from comparing
Milavec’s working capital of $122,000 with another company that also has working
capital of $122,000. By expressing the relationship between current assets and current
liabilities as a ratio, however, we have a more useful measure of the company’s debt-
paying ability relative to other companies. The current ratio, also called the working
capital ratio, is calculated as follows.
Current assets
Current ratio 5
Current liabilities
To illustrate using the current ratio for comparisons, consider Milavec’s current
position relative to Laroque’s, a larger firm with current assets of $500,000 and current
liabilities of $378,000.
Milavec
Laroque
Current assets (a)
$168,000
$500,000
2 Current liabilities (b)
46,000
378,000
Working capital
$122,000
$122,000
Current ratio (a 4 b)
3.65:1
1.32:1
The current ratio is expressed as the number of dollars of current assets for each
dollar of current liabilities. In the above example, both companies have the same
amount of working capital. Milavec, however, appears to have a much stronger working
capital position. Any conclusions from this analysis must take into account the circum-
stances of the particular companies; there is no single ideal current ratio that suits all
companies. In recent years the average current ratio of the 30 companies that constitute
the Dow Jones Industrial Average was around 1.21:1. The individual company ratios,
however, ranged from .40:1 to 2.20:1. A current ratio can be too high. Money invested
in factories and developing new products is usually more profitable than money held as
large cash balances or invested in inventory.
ADVERTISEMENT
0 votes
Related Articles
Related forms


Related Categories
Parent category: Financial