Observing Phase Changes Science Worksheets Page 2
ADVERTISEMENT
 1
1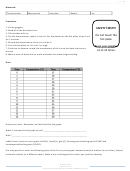 2
2 3
3 4
4P a g e
| 2
Materials:
Thermometer
Map pencils
Hot plate
Beaker
Ice
Procedure:
1. Put on goggles.
SAFETY FIRST!!!
2. Read all of the directions first.
3. Fill a beaker with ice.
Do not touch the
4. Put the thermometer sensor in the ice. Set the beaker on the hot plate. Keep it still
for 2 minutes.
hot plate.
5. Record the temperature of the ice at time 0.
6. Turn the hot plate on. Set it at 7 or high.
Keep your goggles
7. Continue to observe record the temperature of the ice on the data chart every
on at all times.
minute.
8. Make a note of when the ice melts and when the water begins boiling.
Data:
Graph your data. Remember to label and title the graph.
What is the best kind of graph to use? ___________________________________
Why? ______________________________________________________________
Label these 5 areas on your graph: solid (S), liquid (L), gas (G), freezing point/melting point FP/MP and
condensation/boiling point (CP/BP).
Use map pencils to color the following parts of the line on your graph: slowest molecular motion (in one color), fastest
molecular motion (in a different color). Make a key to distinguish the colors you used for labeling.
M. Poarch 2015
science-class.net
Permission to copy granted for non-profit, educational use only.
ADVERTISEMENT
0 votes
Related Articles
Related forms


Related Categories
Parent category: Education