Acid Titration Curve Page 4
ADVERTISEMENT
 1
1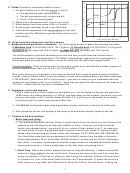 2
2 3
3 4
4Note: Please detach this Report Form before handing in! Staple data table, plot, etc. after detachment.
Report Form: Acid Titration Curve
Name(s):______________________________
I. Raw Data (and assumed quantities)
Name of Acid (or Acid Salt):__________________ Volume of water used to dissolve acid: _________
pH and “Volume of NaOH(aq) added” values: Attach table of raw data and plot (titration curve).
[NaOH]
= ___________ (Assumed quantity; this is not raw data because it wasn’t measured by you)
titrant
II. Data Analysis and Calculations
1. (a) Use your plot, your raw data table, and definitions from class to determine the following as precisely as
your data allow:
(V at equivalence point) = ______
pH at equivalence point: ________
V
ep
1
(V at half-equivalence point)
= ______
pH at half-equivalence point: _______
V
½ ep
pK
of acid (from experiment): _______
of acid (from experiment): _________
K
a
a
(b) Find a published pK
value (or find a K
value and calculate the pK
yourself) for your acid (check your
a
a
a
book’s appendix, the CRC handbook, or another reference provided). Comment on the agreement
between your value and the published one. Suggest ideas why the values might not be identical.
pK
of acid (published value): _______
Comments:
a
Source: ___________________________
2. (a) initial moles of acid = ________ (Do NOT use mass and molar mass here! Use the titration!)
Show calculation:
initial concentration of acid ([acid]
) = _________ Show calculation:
o
(b) Using YOUR experimental K
value (and other "amounts" from above, as needed) calculate a
a
value for what the pH "should" be (according to theory) at the following points:
(i) at the beginning of the titration.
Use back of page to show calculation; copy the result here: _________ (theoretical)
actual pH at beginning of titration (from raw data): _______ (experimental)
Comment on the agreement between the calculated and experimental values.
(ii) at the equivalence point.
Note: If values
are not within 1
Use back of page to show calculation; copy the result here: _________ (theoretical)
pH unit of one
another (and often
actual pH at equivalence point (from raw data): _______ (experimental)
much closer),
check your
Comment on the agreement between the calculated and experimental values.
calculations!
(iii) after 20.0 mL of titrant were added
Use back of page to show calculation; copy the result here: _________ (theoretical)
actual pH after 20.0 mL of titrant added (from raw data): _______ (experimental)
Comment on the agreement between the calculated and experimental values.
1
Interpolate, if necessary!! Ask me if you do not know how to do an interpolation.
ADVERTISEMENT
0 votes
Related Articles
Related forms


Related Categories
Parent category: Education