Descriptive Statistics Worksheet Page 2
ADVERTISEMENT
 1
1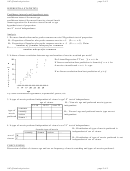 2
2HdPrjDataAnalysis.docx
page 2 of 2
INFERENTIAL STATISTICS
Confidence intervals and hypothesis tests
confidence interval for mean age
confidence interval for mean # movies viewed /week
linear regression for # movies viewed /week vs age
hypothesis test of proportion
two
test of independence
Analysis
1. Do more females than males prefer romance movies? Hypothesis test of proportion
H
: Proportion of females who prefer romance movies =.5 (P
=.5)
0
Females
H
: Proportion of females who prefer romance movies > .5 (P
>.5) Claim
a
Females
P
=
Females
2. Is there a linear correlation between age and number of movies watched per week?
Do Linear Regression T Test
If linear correlation then prediction is formula
·
# movies viewed/week =
If no linear correlation then best prediction of
is .
Try other correlations logarithmic, exponential, power, etc.
3. Is type of movie preferred independent of viewer's age?
test of independence
H
: Viewer's age and preferred movie type are
age of viewer
0
-
independent
13-18
18-25
over 25
romance
type of
H
: Viewer's age and preferred movie type are not
comedy
a
movie
independent
action
preferred
drama
4. Is type of movie preferred independent of viewer's sex?
test of independence
H
:Distribution of type of movie preferred is
favorite type of movie
0
independent of sex of viewer
comedy
drama
action
…
M
sex of
H
: Distribution of type of movie preferred is not
a
viewer
F
independent of sex of viewer
CONCLUSIONS
Discussion of effect of viewers age and sex on frequency of movie watching and types of movies preferred.
HdPrjDataAnalysis.docx
page 2 of 2
ADVERTISEMENT
0 votes
Related Articles
Related forms


Related Categories
Parent category: Education