Python Loops And Images Lab
ADVERTISEMENT
 1
1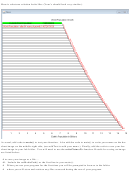 2
2 3
3Lab 4 Python Loops and Images
Objectives
to use while loops and for loops
to further explore image and pixel features
to further understand and practice using parameters in functions
Copy the Lab 4 folder into your M:/CS150/Labs folder. Write a Python program to complete these exercises
called yourNameLab04Loops.py, (ie. MillerJohnLab04Loops.py). As you complete this lab, show your lab
instructor or TA the result of each part before continuing on and when you are finished, hand in your program
in the N:\HandIns\CS150 folder.
Exercise 1: Using a while loop
The human population of the world has been rising over the years. In recent years the annual growth rate has
been around 1.1%, but was at its peak of around 2% in the 1960’s.
Create a Python function called yearsToDouble that takes two parameters, an integer representing the world’s
current population, and a decimal value representing the annual growth rate of the population and returns the
number of years it would take for the population to double. Your function should use a while loop that will
continue to repeat the calculation for the future population of each succeeding year until the population doubles.
Once you have created the yearsToDouble function, write a main() method to test your function. How many
years will it take for the population to double if the annual growth rate is 0.011? ____ 0.02? ____
Exercise 2: Using a while loop and a for loop
Create a Python function called yearsToDoubleGraph to graphically represent the doubling of the earth’s
human population using a horizontal bar chart. Each bar of the chart will represent the population for a
particular year. Your function will take two parameters, an integer representing the world’s current population,
and a decimal value representing the annual growth rate of the population and returns a picture of the chart.
This function is a modification of the function from the first exercise. (start with a copy of the first function and
rename it)
We will assume we know the current population is around 7 billion, so twice that will be less than 15 billion.
Knowing this allows us to create the scale of the graph to 50 pixels per billion.
The current population is over seven billion. See:
to get a
glimpse into how fast it is growing with the visual of a live counter.
To write this function, let’s break this task into parts,(use an algorithm.) You may first want to look at the graph
shown below to get a quick sense of what the algorithm will produce when coded into a solution.
1. create a blank canvas using the makeEmptyPicture function (suggested size 800 x 900)
2. add a title to the canvas
3. add a filled rectangle to the canvas representing the current population (try other colors)
(suggestion: use a scale of 50 pixels per billion for rectangle width and 10 pixels for height)
4. add text to the first bar, indicating the current population
5. use a while loop to add additional bars until the population has doubled.
6. Add text to report how many years it took to double and the population at that point
7. Add a line below the graph to be used as the X axis
8. Use a for loop to put number labels on the line. (suggestion: again use spacing of 50 pixels per #)
9. Add a label for the X axis below the numbered line
10. Return the canvas
ADVERTISEMENT
0 votes
Related Articles
Related forms
")


")


Related Categories
Parent category: Education