Modern Methods For Manufacturing Planning And Scheduling Page 2
ADVERTISEMENT
 1
1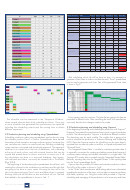 2
2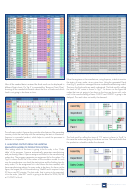 3
3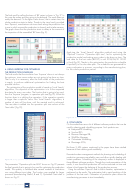 4
4 5
5Work Centers Jobs
Hours Start Stop Quantity Due
On Time
Cutter 1
Cutting A
8
0
8
5000
120
TRUE
Cutter 1
Cutting B
8
0
8
5000
120
TRUE
Cutter 1
Cutting C
8
0
8
5000
120
TRUE
Processing 1
Processing A
8
8
16
5000
120
TRUE
Processing 1
Processing B
8
8
16
5000
120
TRUE
Processing 1
Processing C
8
8
16
5000
120
TRUE
Inspection A
9
16
25
5000
120
TRUE
Inspection 1
Inspection B
9
25
34
5000
120
TRUE
Inspection C
9
34
43
5000
120
TRUE
Assembly AX
34
25
59
2500
120
TRUE
Assembly
Assembly BX
34
59
93
2500
120
TRUE
Assembly CX
23
93
116
1692
120
TRUE
Inspection AX
9
59
68
2500
120
TRUE
Inspection 2
Inspection BX
9
93
102
2500
120
TRUE
Inspection CX
9
116
125
1692
120
FALSE
Packing AX100 2
68
70
100
120
TRUE
Packing AX200 4
70
74
200
120
TRUE
Packing BX100 2
102
104
100
120
TRUE
Packing
Packing BX200 4
104
108
200
120
TRUE
Packing CX100 2
125
127
100
120
FALSE
Packing CX200 4
127
131
200
120
FALSE
Table 1. Applied date for simulating the production model using spreadsheets
After calculating which job will be done on time, it is necessary to
Figure 1. Full list of the jobs for producing the simulation model in ‘Lekin’
generate a Gantt chart in order to visualize the result. “Excel” spreadsheets
can be used to generate such chart. Part of the generated Gantt chart
is show in ‘fig.3’.
Figure 3. Generating a Gantt chart using “Excel” spreadsheets
Figure 2. Gantt chart of the jobs in the environment of ‘Lekin’
Every square is equal to one hour. The jobs that are going to be late are
The schedule can be examined in the ‘Sequence Window’,
presented in different color. After visualizing the result, the manufacturer
where several relevant data of the schedule are shown. Once one
can easily decide what changes needs to be made.
or more schedules are generated their performance are specified
2.3 Production planning and scheduling using ‘Asprova’
including the scheduling criteria and the running time to obtain
different sequences.
At the beginning of planning and scheduling the production with ‘Asprova
’
®
(Asprova Corporation) the manufacturer have to pick a type of production
2.2 Production planning and scheduling using ‘Spreadsheets’
module. The software product’ Asprova’ is divided into different modules.
Scheduling production order using spreadsheets can be done by using
The objectives vary by each module. The module that is going to be
the software product ‘Excel’ or similar. Spreadsheets have earned
used to schedule the production is ‘Advance Planning and Scheduling
themselves a bad reputation amongst software purists, because they
(APS)’. Data that Asprova requires for scheduling can be input directly,
can, and often are, used in an unstructured way. Building a scheduling
imported from an external system or text files, or copied and pasted from
system requires a structured and disciplined approach. The approach
‘Microsoft Excel’.
used here is to create lists in the form of databases, with a heading
The ‘Integrated Master Editor’ is a table for maintaining master data. It
at the top of each column, and with universal formulas that can be
is especially convenient for creating and editing master data because it
copied and pasted down a column, and work on every row. If all
combines master settings and related information in a single table. The
the calculations are done in a structured database, then reports,
‘Asprova APS’ master data is created using the ‘Integrated Master Editor’.
with sub-totals and charts, can easily be created with a ‘PivotTable’
Basically inputting data into the ‘Integrate Master’ is like inputting data
[Rice 2014].
into the ‘Excel’ spreadsheets (fig.4).
The beginning of the developing the spreadsheets should start, with
Asprova has the possibility to create and maintain production orders.
creating the columns for the workcenters or machines and the jobs that
The full list of the orders is shown in ‘fig.4’
are going to be done in every center. Knowing the time set for the
In the “Order” table manufacturer adds settings about every information
jobs to be done and using ‘Excel’ a true and false column is created,
regarding the production of the items, such are sales or resource purchases,
showing which job will be done on time and which will not. The final
due dates, quantites, ect. Using the order table provided in ‘Asprova’,
date added to the spreadsheets is shown in ‘tab. 1’.
scheduling and managing of the productions is a lot more easy and clear.
| 2015 | OCTOBER |
636
SCIENCE JOURNAL
ADVERTISEMENT
0 votes
Related Articles
Related forms
 Form R-1070 - Application For Certification As A Manufacturer Or Farmer For The Purpose Of The Sales/use Tax Exclusion For Manufacturing Machinery And Equipment
Financial
Form R-1070 - Application For Certification As A Manufacturer Or Farmer For The Purpose Of The Sales/use Tax Exclusion For Manufacturing Machinery And Equipment
Financial
 Form 50a - Nebraska Application For Manufacturers, Distributors, And Manufacturer-distributors Of Bingo Equipment, Pickle Cards, Or County/city Lottery Equipment
Financial
Form 50a - Nebraska Application For Manufacturers, Distributors, And Manufacturer-distributors Of Bingo Equipment, Pickle Cards, Or County/city Lottery Equipment
Financial


 - Country-by-country Report")
 - Consent Plan And Apportionment Schedule For A Controlled Group")
 - Consent Plan And Apportionment Schedule For A Controlled Group")
Related Categories
Parent category: Education