Modern Methods For Manufacturing Planning And Scheduling Page 4
ADVERTISEMENT
 1
1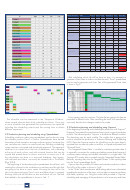 2
2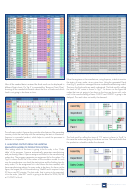 3
3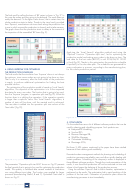 4
4 5
5The final result for selling the items of ‘BX’ series is shown in “fig. 9”. In
this case the orders are also going to be delayed. The result does not
satisfy the demand. On the figure is also shown, that in certain time, the
whole production starts to delay. Thanks to the visual result, provided
from ’Asprova’, manufacturer can trace back along the production line
to see in which moment the production is slowed, and to take measure.
The graph shows that the production starts to delay at the moment of
the inspection of the assembled ‘BX’ items (fig. 9).
Figure 11. Resource Gantt chart after optimization
Applying the ‘Local Search’ algorithm method and using the
“Asprova” function “Operation split size”, led to optimizing the
production model and setting every order to be done on time. The
end date for the last order (BX100) is until 2016/06/21 00:00
o’clock (fig.12). Thanks to this optimization the production schedule
fit perfectly to the due date plan. The schedules are generated for
Figure 9. Gantt chart for selling the constructions with Shaft-B
every workcenter or process, according to the manufacturing plan,
4. USING ‘ASPROVA’ FOR OPTIMIZING
for the whole production period.
THE PRODUCTION SCHEDULES
The final results that the simulation from ‘Asprova’ shows is not always
the optimum, since some orders are not going to be done on time.
That is why it is necessary, after the final model of the production
is ready, to perform additional optimization for finding the best
possible solution.
The optimization of the production model is based on ‘Local Search’
algorithms. The objective of the optimization is to fit the requested
due dates for every one order. The function that is going to be used,
from the ‘Asprova' program, is operation split size (fig.10). What the
function does is a splitting the operation, if the operation quantity
is larger than a specific value. Like ‘Local Search’ algorithms, a
number of tests will be done, until the wanted result is achieved.
The new data is added into the operation split size column of the
‘Item table’ [fig.10].
Figure 12. End time of the final order in the simulation model of production
5. CONCLUSION
On the market there are a lot of different software products that can be
used for planning and scheduling purpose. Such products are:
• EnterpriselIQ Scheduling;
• Synchro PRO;
• Resourse Manager DB;
• SMARTer Manager;
• Orchestrate Scheduling;
• Planvisage SCM;
But those 3 APS systems mentioned in the paper have been studied
because of their relative good availability.
Presented modern management methods for planning and scheduling of
production processes are reliable, easy and allow quickly dealing with
certain problems. Scheduling of the company's orders is displayed in
Figure 10. Using operation split size function in ‘Asprova’
three different software products. Through the visual presentation of the
The parameters “Operation split size MAX” shown on ‘fig.10’ presents
results, it was found that production will not be executed on time and
the final quantity that is going to be used for optimizing the production
where in fact began the delaying of the production process.
model. This quantity is achieved after several numbers of simulations
Using the software "Asprova" and its built-in features, optimization is
runs using different input data. The function was applied for larger
performed on the results. The optimization led to rapid resolution of the
processes (manufacturing Shaft-A, B and C). Optimized Gantt chart is
problem of the late work. Generation of production plans allows the
shown on ‘fig.11’.
manufacturing processes to start immediately.
| 2015 | OCTOBER |
638
SCIENCE JOURNAL
ADVERTISEMENT
0 votes
Related Articles
Related forms
 Form R-1070 - Application For Certification As A Manufacturer Or Farmer For The Purpose Of The Sales/use Tax Exclusion For Manufacturing Machinery And Equipment
Financial
Form R-1070 - Application For Certification As A Manufacturer Or Farmer For The Purpose Of The Sales/use Tax Exclusion For Manufacturing Machinery And Equipment
Financial
 Form 50a - Nebraska Application For Manufacturers, Distributors, And Manufacturer-distributors Of Bingo Equipment, Pickle Cards, Or County/city Lottery Equipment
Financial
Form 50a - Nebraska Application For Manufacturers, Distributors, And Manufacturer-distributors Of Bingo Equipment, Pickle Cards, Or County/city Lottery Equipment
Financial


 - Country-by-country Report")
 - Consent Plan And Apportionment Schedule For A Controlled Group")
 - Consent Plan And Apportionment Schedule For A Controlled Group")
Related Categories
Parent category: Education