Modern Methods For Manufacturing Planning And Scheduling Page 3
ADVERTISEMENT
 1
1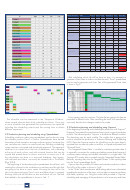 2
2 3
3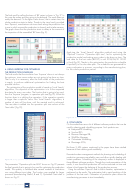 4
4 5
5Figure 6. The assignment list with the time needed for the orders to be done
Either the engineer or the manufacturer, using Asprova, is able to monitor
Figure 4. Order table
the status, of every order, at any given time. Using the generated Gantt
After all the needed data is entered the finale result can be displayed in
chart (fig.5), production managers receive visualized manufacturing model.
different Gantt charts. On ‘fig.5’ is presented the ‘Resource Gantt Chart’
That way, the final results are easily understood. The final result for selling
showing all the needed information about the flow of loads and which
the items of ‘AX’ series is shown in ‘fig.7’. As shown on the figure the
load is not going to be done on time.
orders that are not going to be done on the time are shown with color
red. In this case the selling of items ‘AX100’ and ‘AX200’ is going to be
delayed. The result does not satisfy the demand.
Figure 5. ‘Resource Gantt Chart’ of the production mode
The software product Asprova also provides other features, like generating
Figure 7. Gantt chart for selling the constructions with Shaft-A
inventory chart that can help with the maintaining the items in inventories.
Asprova is a powerful product, which helps to control the processes in
The final result for selling the items of ‘CX’ series is shown in ‘fig.8’. In
factories or companies.
this case the orders are going to be done on time. The result shows that
the production schedule satisfies the demand.
3. ANALYZING OUTPUTS FROM THE ASPROVA
SIMULATION MODEL OF PRODUCTION SYSTEM
After setting which of the items is going to be for sale, in the ‘Order
table’ of the program, Asprova automatically generates manufacturing
and purchasing orders. Asprova assigns end times for the manufacturing
orders also. The program generates an assignment list for the orders. On
‘fig.6’ is shown the full list of the orders of the simulation model. In such
way the manufacturer can check the starting time and the finishing time for
every order. On the assignment list is also shown the time needed, with
these manufacturing settings, for every order to be done. As shown on the
figure, the longest job is for manufacturing ‘Shaft-B’ and it requires 6 days
22 hours and 20 minutes. The last order, that is going to be executed,
is for the order „Sale BX1“ and it is going to be done on 2016/06/22
at 15:05:00 o’clock.
Figure 8. Gantt chart for selling the constructions with Shaft-C
2015 | OCTOBER |
|
SCIENCE JOURNAL
637
ADVERTISEMENT
0 votes
Related Articles
Related forms
 Form R-1070 - Application For Certification As A Manufacturer Or Farmer For The Purpose Of The Sales/use Tax Exclusion For Manufacturing Machinery And Equipment
Financial
Form R-1070 - Application For Certification As A Manufacturer Or Farmer For The Purpose Of The Sales/use Tax Exclusion For Manufacturing Machinery And Equipment
Financial
 Form 50a - Nebraska Application For Manufacturers, Distributors, And Manufacturer-distributors Of Bingo Equipment, Pickle Cards, Or County/city Lottery Equipment
Financial
Form 50a - Nebraska Application For Manufacturers, Distributors, And Manufacturer-distributors Of Bingo Equipment, Pickle Cards, Or County/city Lottery Equipment
Financial


 - Country-by-country Report")
 - Consent Plan And Apportionment Schedule For A Controlled Group")
 - Consent Plan And Apportionment Schedule For A Controlled Group")
Related Categories
Parent category: Education