Interpreting Line Plots Math Worksheet With Answer Key
ADVERTISEMENT
 1
1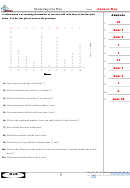 2
2Interpreting Line Plots
Name:
A saleswoman was counting the number of cars she sold each hour on the line plot
A n s w e r s
below. Use her line plot to answer the questions.
10
1.
12
6
4
2
11
1
10
3
5
8
hour 1
2.
×
×
×
hour 6
×
×
×
3.
×
×
×
×
×
×
×
1
4.
×
×
×
×
×
×
×
×
×
1
×
×
×
×
×
×
5.
×
×
×
×
×
×
×
×
×
×
×
×
×
×
×
11
6.
×
×
×
×
×
×
×
×
×
×
×
×
×
×
×
×
×
×
×
hour 1
7.
1
2
3
4
5
6
7
8
9
10
Hours
Hours
Hours
Hours
Hours
Hours
Hours
Hours
Hours
Hours
hour 6
8.
1) How many cars did she sell in hour 7?
1
9.
2) Did she sell more cars in hour 4 or in hour 1?
6
10.
3) Did she sell fewer cars in hour 2 or in hour 6?
hour 10
11.
4) How many hours did she sell more than 11 cars?
5) How many hours did she sell fewer than 2 cars?
6) What is the combined number of cars she sold in hour 10 and in hour 8?
7) She sold the most cars which hour?
8) Which hour did she sell the fewest cars?
9) Which hours (if any) did she sell more than 11 cars?
10) What is the difference in the number of cars she sold in hour 7 and the number she sold in
hour 3?
11) Which hour did she sell exactly 8 cars?
1-10 91 82 73 64 55 45 36 27 18 9
Math
5
11
0
ADVERTISEMENT
0 votes
Related Articles
Related forms


Related Categories
Parent category: Education