Reading A Bar Graph Worksheet
ADVERTISEMENT
 1
1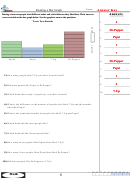 2
2Name:
Reading a Bar Graph
During a taste test people tried different sodas and said which one they liked best. Their answers
A n s w e r s
were recorded on the bar graph below. Use the graph to answer the questions.
Taste Test Results
4
1.
Dr.Pepper
2.
Pepsi
3.
1
4.
7
5.
Sprite
Pepsi
7-Up
Dr.Pepper
Dr.Pepper
6.
Pepsi
7.
1) How many people said 7-Up was their favorite drink?
1
8.
5
9.
2) Did more people like Pepsi or Dr.Pepper?
7-Up
10.
3) Which drink did exactly 3 people say was their favorite?
4) What is the difference in the number of people who liked 7-Up and the number
who liked Pepsi?
5) What is the combined number of people who liked 7-Up and Pepsi?
6) Which drink did the most people like?
7) Which drink did the fewest people like?
8) How many more people liked Sprite than liked 7-Up?
9) How many fewer people liked Pepsi than liked Dr.Pepper?
10) Did fewer people like Dr.Pepper or 7-Up?
90 80 70 60 50 40 30 20 10 0
1-10
6
Math
ADVERTISEMENT
0 votes
Related Articles
Related forms


Related Categories
Parent category: Education