Math Activity Sheets Page 10
ADVERTISEMENT
 1
1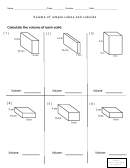 2
2 3
3 4
4 5
5 6
6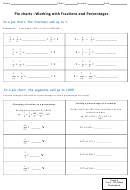 7
7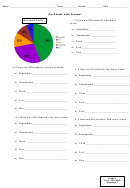 8
8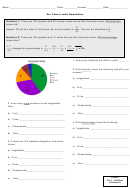 9
9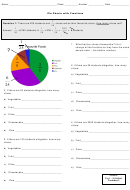 10
10Name: ____________________________________ Class: __________ Number: ____________ Date: ______________
Pie Charts with Fractions
Question 1: There are 200 students and
chose red as their favourite colour. How many chose red?
4
1
Answer:
of 200 students is
x 200 =
x
= 4 students
50
1
1
1. What fraction chose cheesecake? (hint:
25
change all the fractions so they have the same
?
denominator – the bottom number)
____________________________
2. If there are 50 students altogether, how many
chose:
a) Vegetables ____________________________
6
25
b) Fruit_________________________________
3. If there are 25 students altogether, how many
c) Pizza ________________________________
chose:
a) Vegetables ____________________________
d) Cheesecake___________________________
b) Fruit_________________________________
e)
Rice ________________________________
c) Pizza ________________________________
d) Cheesecake___________________________
4. If there are 2000 students altogether, how many
chose:
e)
Rice ________________________________
a) Vegetables ____________________________
5. If there are 100 students altogether, how many
b) Fruit_________________________________
chose:
a) Vegetables ____________________________
c) Pizza ________________________________
b) Fruit_________________________________
d) Cheesecake___________________________
c) Pizza ________________________________
e)
Rice ________________________________
d) Cheesecake___________________________
Grade 6
Test 3 – 2014 Math
e)
Rice ________________________________
Worksheet 9
ADVERTISEMENT
0 votes
Related Articles
Related forms


Related Categories
Parent category: Education