Target Heart Rate Worksheet Page 5
ADVERTISEMENT
 1
1 2
2 3
3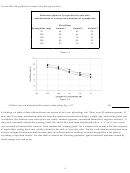 4
4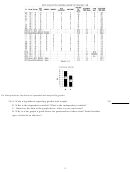 5
5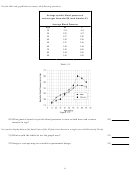 6
6 7
7 8
8Table 1-3
For these questions, the data were separated and analyzed by gender.
19) A. Write a hypothesis regarding gender and weight.
19)
B. What is the dependent variable? What is the independent variable?
C. Based on the data in the graph above, what is your conclusion?
D. Why is a bar graph a good choice for presentation of these data? Would another
type of chart be as effective?
5
ADVERTISEMENT
0 votes
Related Articles
Related forms


Related Categories
Parent category: Medical