Instruction For Retailers Motor Fuel Gallons Annual Report - 2014 Page 12
ADVERTISEMENT
 1
1 2
2 3
3 4
4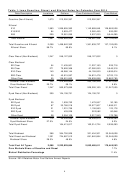 5
5 6
6 7
7 8
8 9
9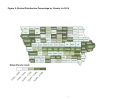 10
10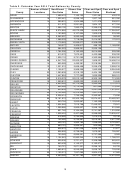 11
11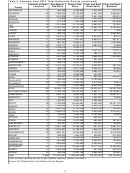 12
12 13
13Table 2. Calendar Year 2014 Total Gallons by County (continued)
Number of Retail
Non-Ethanol
Ethanol Gas
Clear and Dyed
Clear and Dyed
Locations
Gas Sales
Sales
Diesel Sales
Biodiesel
County
17
965,426
5,366,263
1,340,769
872,770
JEFFERSON
59
7,256,034
42,120,533
5,491,589
5,996,647
JOHNSON
13
1,015,306
7,613,913
2,451,459
625,510
JONES
12
479,984
4,074,623
1,490,958
1,244,936
KEOKUK
19
831,912
7,348,765
9,969,709
623,538
KOSSUTH
25
2,211,605
14,172,050
4,983,207
750,052
LEE
87
12,034,833
82,057,462
10,082,793
5,465,565
LINN
8
498,196
3,927,182
907,161
1,500
LOUISA
7
386,742
2,792,741
0
2,954,842
LUCAS
14
1,057,317
5,736,378
2,973,901
28,161
LYON
11
1,085,956
7,451,061
6,963,751
937,871
MADISON
17
881,781
9,360,011
4,103,878
1,674,268
MAHASKA
23
1,286,777
13,030,314
3,883,494
45,098
MARION
23
2,339,616
11,938,211
0
1,433,929
MARSHALL
10
545,640
5,153,586
2,747,781
176,714
MILLS
10
641,835
3,402,518
296,170
196,725
MITCHELL
11
1,461,969
5,194,939
3,866,940
1,443,066
MONONA
6
345,779
3,196,583
251,083
0
MONROE
7
528,213
3,031,375
915,801
0
MONTGOMERY
22
2,474,144
13,732,211
3,020,067
557,706
MUSCATINE
19
988,379
6,017,423
2,936,478
162,858
OBRIEN
7
225,202
2,320,250
2,684,273
33,491
OSCEOLA
6
414,135
2,859,966
403,002
0
OTHER
9
569,651
5,687,711
654,355
528,614
PAGE
11
402,304
4,138,723
3,102,539
0
PALO ALTO
23
2,227,743
8,906,007
5,019,694
23,614
PLYMOUTH
9
314,398
2,497,266
6,045,005
13,897
POCAHONTAS
185
38,839,714
172,243,978
24,225,407
65,283,768
POLK
62
6,198,152
54,070,245
9,297,117
24,749,878
POTTAWATTAMIE
17
1,644,167
9,920,533
7,021,709
15,801,977
POWESHIEK
6
170,993
1,316,181
1,542,837
78,906
RINGGOLD
17
605,237
4,680,871
2,365,506
0
SAC
80
5,103,629
84,949,581
8,392,065
53,031,793
SCOTT
13
589,550
4,234,769
3,525,076
1,156,654
SHELBY
32
2,654,555
10,144,522
10,908,799
728,436
SIOUX
43
5,690,612
33,401,636
4,200,299
2,914,491
STORY
15
748,602
7,646,450
2,162,486
29,993
TAMA
7
117,813
2,060,240
652,525
0
TAYLOR
11
655,840
4,912,306
994,580
387,661
UNION
8
263,791
2,310,183
750,257
83,592
VAN BUREN
27
2,091,158
15,126,339
-801,913
3,887,157
WAPELLO
25
2,619,897
19,196,877
1,536,120
1,006,207
WARREN
25
1,652,781
12,043,839
5,139,207
8,512,326
WASHINGTON
7
228,303
1,934,472
338,587
577,248
WAYNE
28
1,571,849
15,399,044
4,276,273
105,092
WEBSTER
18
687,690
4,729,297
2,339,227
102,902
WINNEBAGO
17
1,608,062
7,442,880
3,358,248
4,233
WINNESHIEK
50
8,154,512
37,682,679
12,717,794
15,493,480
WOODBURY
10
1,994,348
3,254,648
501,566
457,575
WORTH
20
855,439
5,093,199
3,686,045
100,681
WRIGHT
2,088
213,252,397
1,285,689,958
370,236,583
354,750,929
Total
Other includes counties with five or less retailers reporting. (Adams and Davis)
Source: 2014 Retail Motor Fuel Gallons Annual Reports
11
ADVERTISEMENT
0 votes
Related Articles
Related forms


Related Categories
Parent category: Financial