Instruction For Retailers Motor Fuel Gallons Annual Report - 2014 Page 5
ADVERTISEMENT
 1
1 2
2 3
3 4
4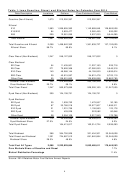 5
5 6
6 7
7 8
8 9
9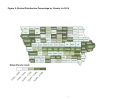 10
10 11
11 12
12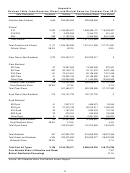 13
13Table 1. Iowa Gasoline, Diesel, and Biofuel Sales for Calendar Year 2014
Data Description
Locations
Gallons
Pure Petroleum/Diesel
Pure Biofuel
Gasoline (Non-Ethanol)
1,673
213,252,397
213,252,397
0
Ethanol
E10
1,983
1,269,655,383
1,142,689,845
126,965,538
E15/E20
84
3,953,477
3,360,455
593,022
E85
209
12,081,095
2,537,030
9,544,065
Total Ethanol
1,991
1,285,689,955
1,148,587,330
137,102,625
Total Gasoline and Ethanol
2,058
1,498,942,352
1,361,839,727
137,102,625
Ethanol Share
96.7%
85.8%
9.1%
Clear Diesel (Non-Biodiesel)
1,247
246,127,832
246,127,832
0
Clear Biodiesel
B2 Clear
54
11,435,901
11,207,183
228,718
B5 Clear
271
70,926,368
67,380,050
3,546,318
B10 Clear
140
49,066,144
44,159,530
4,906,614
B20 Clear
29
43,515,597
34,812,478
8,703,119
Other Clear
55
139,501,853
125,639,088
13,862,765
Subtotal Clear Biodiesel
326
314,445,863
283,198,328
31,247,535
Clear Biodiesel Share
20.7%
56.1%
9.9%
Total Clear Diesel
1,247
560,573,695
529,326,160
31,247,535
Dyed Diesel (Non-Biodiesel)
309
124,108,751
124,108,751
0
Dyed Biodiesel
B2 Dyed
35
1,509,752
1,479,557
30,195
B5 Dyed
87
33,766,218
32,077,907
1,688,311
B10 Dyed
21
1,231,759
1,108,583
123,176
B20 Dyed
12
403,228
322,582
80,646
Other Dyed
28
3,394,109
3,217,343
176,766
Subtotal Dyed Biodiesel
114
40,305,066
38,205,973
2,099,093
Dyed Biodiesel Share
27.0%
24.5%
5.2%
Total Dyed Diesel
164,413,817
162,314,724
2,099,093
Total Biodiesel
368
354,750,929
321,404,301
33,346,628
Total Diesel and Biodiesel
1,301
724,987,512
691,640,884
33,346,628
Biodiesel Share
28.3%
48.9%
4.6%
Total Fuel All Types
2,088
2,223,929,864
2,053,480,611
170,449,253
Pure Biofuels Share of Gasoline and Diesel
7.7%
Biofuel Distribution Percentage
11.4%
Source: 2014 Retailers Motor Fuel Gallons Annual Reports
4
ADVERTISEMENT
0 votes
Related Articles
Related forms


Related Categories
Parent category: Financial