Instruction For Retailers Motor Fuel Gallons Annual Report - 2014 Page 9
ADVERTISEMENT
 1
1 2
2 3
3 4
4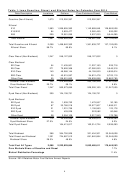 5
5 6
6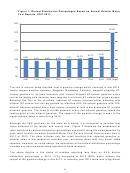 7
7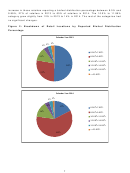 8
8 9
9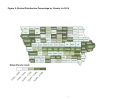 10
10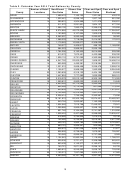 11
11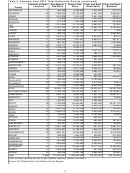 12
12 13
13To further illustrate the variation in sales of biofuel among Iowa retailers, Figure 3 maps
the biofuel distribution percentage calculated by county. These percentages are based
on total sales reported by the retailers within each county who remitted the 2014 annual
gallons report. No county exceeded the 25% goal, although nine counties had pure
biofuel sales comprising between 15.0% and 24.99% of total motor fuel sales. Only five
counties had biofuel distribution percentages below 8.0%. The majority of the counties
(forty-five) fall in the 8.0% to 9.99% category.
Table 3 provides the total gallons of non-ethanol gasoline, ethanol, clear and dyed non-
biodiesel diesel, and clear and dyed biodiesel gallons for all counties with more than five
retailers reporting sales to the Department.
8
ADVERTISEMENT
0 votes
Related Articles
Related forms


Related Categories
Parent category: Financial