Instruction For Retailers Motor Fuel Gallons Annual Report - 2014 Page 13
ADVERTISEMENT
 1
1 2
2 3
3 4
4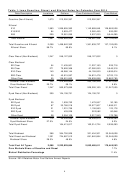 5
5 6
6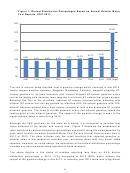 7
7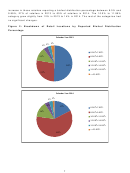 8
8 9
9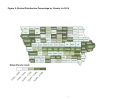 10
10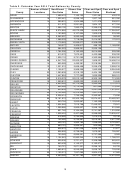 11
11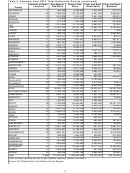 12
12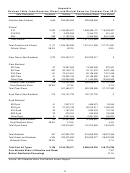 13
13Appendix
Revised Table. Iowa Gasoline, Diesel, and Biofuel Sales for Calendar Year 2013
Data Description
Locations
Gallons
Pure Petroleum/Diesel Pure Biofuel
Gasoline (Non-Ethanol)
1,845
259,638,996
259,638,996
0
Ethanol
E10
2,022
1,185,095,674
1,066,586,107
118,509,567
E15/E20
77
2,876,206
2,444,775
431,431
E85
206
11,152,763
2,342,080
8,810,683
Total Ethanol
2,032
1,199,124,643
1,071,372,962
127,751,681
Total Gasoline and Ethanol
2,117
1,458,763,639
1,331,011,958
127,751,681
Ethanol Share
96.0%
82.2%
8.8%
Clear Diesel (Non-Biodiesel)
1,273
234,033,317
234,033,317
0
Clear Biodiesel
B2 Clear
67
13,627,559
13,355,008
272,551
B5 Clear
267
80,148,715
76,141,279
4,007,436
B10 Clear
141
72,410,451
65,169,406
7,241,045
B20 Clear
31
25,235,740
20,188,592
5,047,148
Other Clear
46
122,000,489
111,440,986
10,559,503
Subtotal Clear Biodiesel
328
313,422,954
286,295,271
27,127,683
Clear Biodiesel Share
20.5%
57.3%
8.7%
Total Clear Diesel
547,456,271
520,328,588
27,127,683
Dyed Diesel (Non-Biodiesel)
313
125,137,732
125,137,732
0
Dyed Biodiesel
B2 Dyed
41
1,527,217
1,496,673
30,544
B5 Dyed
91
27,910,748
26,515,211
1,395,537
B10 Dyed
22
1,167,037
1,050,333
116,704
B20 Dyed
23
679,424
543,539
135,885
Other Dyed
41
3,097,403
2,931,202
166,201
Subtotal Dyed Biodiesel
125
34,381,829
32,536,957
1,844,872
Dyed Biodiesel Share
28.5%
21.6%
5.4%
Total Dyed Diesel
159,519,561
157,674,689
1,844,872
Total Biodiesel
347
347,804,783
318,832,228
28,972,555
Total Diesel and Biodiesel
1,334
706,975,832
678,003,277
28,972,555
Biodiesel Share
26.0%
49.2%
4.1%
Total Fuel All Types
2,156
2,165,739,471
2,009,015,235
156,724,236
Pure Biofuels Share of Gasoline and Diesel
7.2%
Biofuel Distribution Percentage
10.7%
Source: 2013 Retailers Motor Fuel Gallons Annual Reports
12
ADVERTISEMENT
0 votes
Related Articles
Related forms


Related Categories
Parent category: Financial