Ib/99-1 International Brief - Population Trends: Peru - U.s. Department Of Commerce - Bureau Of The Census - 1999 Page 2
ADVERTISEMENT
 1
1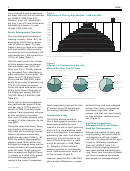 2
2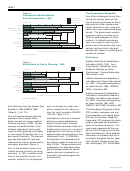 3
3 4
42
IB/99-1
from a trained health professional,
Figure 1.
but fewer than half of rural mothers
Population of Peru by Age and Sex: 1998 and 2020
did (ENDES 1996: Table 8.2).
1998
2020
Similarly, 4 out of 5 urban births
80+
but only 1 out of 5 rural births were
Male
Female
75-79
attended by a doctor or nurse
70-74
65-69
(Endes 1996: Table 8.8).
60-64
55-59
50-54
Peru’s Demographic Transition
45-49
40-44
Peru has been quite successful in
35-39
lowering mortality. Since 1975, life
30-34
25-29
expectancy at birth has increased
20-24
from 57 years to nearly 70 years,
15-19
10-14
fueled in part by a rapid fall in infant
5-9
0-4
and child mortality. Infant mortality
2,000
1,500
1,000
500
0
0
500
1,000
1,500
2,000
has declined from an estimated 105
Thousands
infant deaths per 1,000 live births in
Source: U.S. Bureau of the Census, International Data Base.
1975 to 41 today (Table 1).
Over the same period, the number
Figure 2.
of births women have on average
Changes in Contraceptive Use and
(the total fertility rate (TFR)) has
Method Mix Over Past 20 Years
fallen from 5 to 3. Fertility is declin-
(Percent of married women ages 15 to 49)
ing throughout Peru, albeit faster in
urban areas than in rural areas. Be-
Modern
Modern
Modern
tween the 1977/78 World Fertility
19.9%
23.0%
41.3%
Survey and the 1996 DHS, urban
Traditional
Traditional
Traditional
fertility fell by nearly 40 percent, to a
22.9%
22.8%
21.4%
TFR of 2.8 children per woman.
During the same time period, rural
Nonusers
Nonusers
Nonusers
58.7%
54.2%
35.8%
fertility fell by about 25 percent, to
5.6 children per woman (ENDES
1977/78
1986
1996
1991/92: Table 3.3; ENDES 1996:
Table 3.1).
Source: U.S. Bureau of the Census, International Data Base; and ENDES 1996.
Peru’s rate of natural increase has
also declined from around 2.6 per-
Peru’s dependency ratio will fall from
patterns. Rural and less educated
cent per year in 1975 to about 2.1
67 percent to just 52 percent over
women have lower contraceptive
percent in 1998. If present trends
the coming 2 decades (Table 1).
prevalence rates than other
continue, Peru’s population will grow
women, and they rely more heavily
by over one-third of its present
Contraceptive Use
on less effective, traditional meth-
size—from 26 million persons today
ods (Figure 3).
The fertility decline central to
to nearly 37 million persons—by the
Peru’s demographic transition has
year 2020.
High Risk Pregnancies,
been made possible by an in-
Unwanted Fertility and Unmet
During the same time frame, Peru’s
crease in the use of family planning
Need for Contraception
age structure will become increas-
and a shift to more effective meth-
ingly older and increasingly concen-
Although the practice of family plan-
ods of contraception. Contraceptive
trated in the prime economically
ning is growing, the unmet need for
prevalence has risen from about 41
productive age range (Table 1). By
contraception is still high. Indeed,
percent of married women in the
2020, the working age population
over half of all pregnancies that went
late 1970s to 46 percent in 1986
(persons ages 15-64) will be over
to term in 1996 were considered
and to 64 percent in 1996 (Table
half again as large as today, and the
“high risk” (ENDES: Table 7.5).
2). Adoption of more efficient,
number of elderly will have doubled,
Some of these pregnancies could
modern methods of contraception
while the under-15 age group will
have been avoided with family plan-
since 1986 accounts for nearly all
have increased only slightly (Figure
ning. Apart from the matter of health
of this increase (Figure 2).
1). Largely as a result of the growth
risk, there is evidence that women
of the working age population
were bearing an average of about
However, data from the 1996 DHS
relative to the under-15 population,
show distinct differences in usage
U.S. Census Bureau
ADVERTISEMENT
0 votes
Related Articles
Related forms
 Ref Cpi And Index Ratios For January 2000 - Treasury Inflation-indexed Securities - U.s. Department Of The Treasury, Bureau Of The Fiscal Service
Legal
Ref Cpi And Index Ratios For January 2000 - Treasury Inflation-indexed Securities - U.s. Department Of The Treasury, Bureau Of The Fiscal Service
Legal
 G-20: Fact Sheet On Imf Reform - Office Of The Press Secretary - The White House - U.s. Department Of The Treasury - 2010
Legal
G-20: Fact Sheet On Imf Reform - Office Of The Press Secretary - The White House - U.s. Department Of The Treasury - 2010
Legal
 Fs Form 5336 - Disposition Of Treasury Securities Belonging To A Decedent's Estate Being Settled Without Administration - U.s. Department Of The Treasury
Legal
Fs Form 5336 - Disposition Of Treasury Securities Belonging To A Decedent's Estate Being Settled Without Administration - U.s. Department Of The Treasury
Legal

 - U.s. Department Of The Treasury") State Small Business Credit Initiative - Frequently Asked Questions (faqs) - U.s. Department Of The Treasury
Legal
State Small Business Credit Initiative - Frequently Asked Questions (faqs) - U.s. Department Of The Treasury
Legal
 - Treasury Inspector General For Tax Administration - U.s. Department Of The Treasury") Form 5230 - Advisement Of Rights (non-custodial) - Treasury Inspector General For Tax Administration - U.s. Department Of The Treasury
Legal
Form 5230 - Advisement Of Rights (non-custodial) - Treasury Inspector General For Tax Administration - U.s. Department Of The Treasury
Legal
 Form 8112 - Statement Of Rights And Obligations - Treasury Inspector General For Tax - U.s. Department Of The Treasury
Legal
Form 8112 - Statement Of Rights And Obligations - Treasury Inspector General For Tax - U.s. Department Of The Treasury
Legal
 Special Use Permit - Weddings - Buffalo National River - National Park Service - U.s. Department Of The Interior - 2014
Legal
Special Use Permit - Weddings - Buffalo National River - National Park Service - U.s. Department Of The Interior - 2014
Legal
 - National Park Service - U.s. Department Of The Interior")

Related Categories
Parent category: Legal