Ib/99-1 International Brief - Population Trends: Peru - U.s. Department Of Commerce - Bureau Of The Census - 1999 Page 4
ADVERTISEMENT
 1
1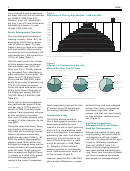 2
2 3
3 4
44
IB/99-1
Table 1.
Table 2.
Population Indicators for Peru:
Contraceptive Prevalence Among Currently
1990 to 2020
Married Women 15 to 49 Years of Age by
Method
(Population in thousands, figures may not add to totals because
of rounding)
Percentage of
Percentage of married
married woman
Indicator
1990
1998
2000
2010
2020
women currently
currently using
using specific
specific methods
POPULATION
methods for
by residence:
Method
selected years
1996
Total country . . . . . . . 21,989 26,111 27,136 32,122
36,904
Urban . . . . . . . . . . . . . 15,150 18,802 19,747 24,503
29,276
Other
Rural. . . . . . . . . . . . . .
6,839
7,308
7,389
7,619
7,628
1977/78
1986
1996 Lima
urban Rural
Male, Total Country
All ages . . . . . . . . . . . 11,068 13,132 13,645 16,133
18,508
All . . . . . . . . . . . . .
41.3
45.8
64.2
71.6
69.2
51.2
Pill . . . . . . . . . . . . .
5.5
6.5
6.2
7.9
6.5
4.3
0 to 14 . . . . . . . . . . . .
4,319
4,741
4,834
4,999
5,038
Condom . . . . . . . .
1.4
0.7
4.4
8.0
4.1
1.4
15 to 44 . . . . . . . . . . .
5,074
6,207
6,469
7,795
8,828
15 to 49 . . . . . . . . . . .
5,493
6,757
7,063
8,635
9,899
IUD . . . . . . . . . . . .
1.8
7.4
12.0
17.1
13.0
6.1
Female
15 to 64 . . . . . . . . . . .
6,366
7,857
8,230 10,288
12,236
sterilization. . . . .
3.6
6.1
9.5
9.6
12.6
5.4
65+ . . . . . . . . . . . . . . .
383
534
581
846
1,234
Other modern . . .
7.6
2.3
9.2
8.2
9.3
10.3
75+ . . . . . . . . . . . . . . .
111
161
176
285
429
Traditional . . . . . .
21.4
22.8
22.9
20.7
23.7
23.7
Female, Total Country
Sources: ENDES 1996, Tables 4.4 and 4.6; and U.S. Bureau of
All ages . . . . . . . . . . . 10,921 12,979 13,491 15,989
18,396
the Census, International Programs Center, International Data
0 to 14 . . . . . . . . . . . .
4,186
4,595
4,682
4,827
4,849
Base.
15 to 44 . . . . . . . . . . .
4,960
6,083
6,343
7,651
8,650
15 to 49 . . . . . . . . . . .
5,377
6,630
6,935
8,491
9,721
15 to 64 . . . . . . . . . . .
6,278
7,752
8,123 10,172
12,105
Table 3.
65+ . . . . . . . . . . . . . .
457
632
686
990
1,443
Other Proximate Determinants of Fertility
75+ . . . . . . . . . . . . . . .
147
217
238
379
568
Married Females
Ages 15 to 49 . . . . . .
3,099
3,902
4,112
5,144
6,051
CHILDLESS WOMEN: 1996
15 to 19 . . . . . . . . . . .
138
160
163
187
189
Percent of currently married women ages
20 to 24 . . . . . . . . . . .
493
579
602
686
752
45 to 49 . . . . . . . . . . . . . . . . . . . . . . . . . . . . . . . . . . . . . . . . . . .
4.6
25 to 29 . . . . . . . . . . .
630
757
789
936
1,081
30 to 34 . . . . . . . . . . .
603
773
808
996
1,142
DURATION OF POSTPARTUM
35 to 39 . . . . . . . . . . .
501
656
702
888
1,061
INFECUNDABILITY: 1996
40 to 44 . . . . . . . . . . .
401
538
574
778
966
45 to 49 . . . . . . . . . . .
334
439
475
673
859
Median Months By Residence
Country. . . . . . . . . . . . . . . . . . . . . . . . . . . . . . . . . . . . . . . . . . . . .
9.6
DEPENDENCY RATIO
Lima . . . . . . . . . . . . . . . . . . . . . . . . . . . . . . . . . . . . . . . . . . . . . . .
8.2
Both sexes . . . . . . . .
73.9
67.3
65.9
57.0
51.6
Other larger centers. . . . . . . . . . . . . . . . . . . . . . . . . . . . . . . . . .
7.9
LIFE EXPECTANCY AT BIRTH (years)
Remaining urban . . . . . . . . . . . . . . . . . . . . . . . . . . . . . . . . . . . .
8.0
Rural . . . . . . . . . . . . . . . . . . . . . . . . . . . . . . . . . . . . . . . . . . . . . . .
12.1
Both sexes . . . . . . . .
65.7
70.0
70.8
74.4
77.1
Male . . . . . . . . . . . . . .
63.6
67.7
68.5
72.0
74.6
Median Months By Educational Attainment
Female . . . . . . . . . . . .
68.0
72.3
73.2
76.9
79.7
None . . . . . . . . . . . . . . . . . . . . . . . . . . . . . . . . . . . . . . . . . . . . . . .
15.3
INFANT MORTALITY RATE (per 1,000 births)
Primary . . . . . . . . . . . . . . . . . . . . . . . . . . . . . . . . . . . . . . . . . . . . .
11.5
Secondary . . . . . . . . . . . . . . . . . . . . . . . . . . . . . . . . . . . . . . . . . .
8.9
Both sexes . . . . . . . .
57.8
40.8
37.1
23.6
15.2
Higher . . . . . . . . . . . . . . . . . . . . . . . . . . . . . . . . . . . . . . . . . . . . . .
6.3
Male . . . . . . . . . . . . . .
64.3
45.9
41.7
26.3
17.0
Female . . . . . . . . . . . .
51.0
35.5
32.4
20.6
13.4
Source: ENDES, 1996, Table 5.12.
UNDER-FIVE MORTALITY RATE (per 1,000 births)
Table 4.
Both sexes . . . . . . . .
81.0
54.7
49.1
29.7
18.5
Age-Specific Fertility Rates
Male . . . . . . . . . . . . . .
87.1
59.6
53.6
32.8
20.5
Female . . . . . . . . . . . .
74.6
49.6
44.4
26.5
16.4
(Per 1,000 women)
MATERNAL MORTALITY RATIO 1989-1996
(per 100,000 births)
Age
1975
1986
1993
1998
2000
Total . . . . . . . . . . . . . .
265
15 to 19. . . . . . . . . . . . . .
93
83
79
67
62
20 to 24. . . . . . . . . . . . . .
238
191
184
167
160
TOTAL FERTILITY RATE
25 to 29. . . . . . . . . . . . . .
265
204
175
165
162
Per woman . . . . . . . .
4.1
3.3
3.1
2.6
2.3
30 to 34. . . . . . . . . . . . . .
220
165
147
129
122
35 to 39. . . . . . . . . . . . . .
174
126
110
90
81
40 to 44. . . . . . . . . . . . . .
70
66
51
39
34
Note: Dependency ratio is the number of persons under age 15
45 to 49. . . . . . . . . . . . . .
16
13
8
7
6
and ages 65 and above per 100 persons ages 15 to 64 years.
Total fertility rate . . . . .
5.4
4.2
3.8
3.3
3.1
Sources: U.S. Bureau of the Census, International Programs
Source: U.S. Bureau of the Census, International Programs
Center, International Data Base; and ENDES 1996, Table 7.12.
Center, International Data Base.
U.S. Census Bureau
ADVERTISEMENT
0 votes
Related Articles
Related forms
 Ref Cpi And Index Ratios For January 2000 - Treasury Inflation-indexed Securities - U.s. Department Of The Treasury, Bureau Of The Fiscal Service
Legal
Ref Cpi And Index Ratios For January 2000 - Treasury Inflation-indexed Securities - U.s. Department Of The Treasury, Bureau Of The Fiscal Service
Legal
 G-20: Fact Sheet On Imf Reform - Office Of The Press Secretary - The White House - U.s. Department Of The Treasury - 2010
Legal
G-20: Fact Sheet On Imf Reform - Office Of The Press Secretary - The White House - U.s. Department Of The Treasury - 2010
Legal
 Fs Form 5336 - Disposition Of Treasury Securities Belonging To A Decedent's Estate Being Settled Without Administration - U.s. Department Of The Treasury
Legal
Fs Form 5336 - Disposition Of Treasury Securities Belonging To A Decedent's Estate Being Settled Without Administration - U.s. Department Of The Treasury
Legal

 - U.s. Department Of The Treasury") State Small Business Credit Initiative - Frequently Asked Questions (faqs) - U.s. Department Of The Treasury
Legal
State Small Business Credit Initiative - Frequently Asked Questions (faqs) - U.s. Department Of The Treasury
Legal
 - Treasury Inspector General For Tax Administration - U.s. Department Of The Treasury") Form 5230 - Advisement Of Rights (non-custodial) - Treasury Inspector General For Tax Administration - U.s. Department Of The Treasury
Legal
Form 5230 - Advisement Of Rights (non-custodial) - Treasury Inspector General For Tax Administration - U.s. Department Of The Treasury
Legal
 Form 8112 - Statement Of Rights And Obligations - Treasury Inspector General For Tax - U.s. Department Of The Treasury
Legal
Form 8112 - Statement Of Rights And Obligations - Treasury Inspector General For Tax - U.s. Department Of The Treasury
Legal
 Special Use Permit - Weddings - Buffalo National River - National Park Service - U.s. Department Of The Interior - 2014
Legal
Special Use Permit - Weddings - Buffalo National River - National Park Service - U.s. Department Of The Interior - 2014
Legal
 - National Park Service - U.s. Department Of The Interior")

Related Categories
Parent category: Legal