Hazard And Vulnerability Analysis Template Page 3
ADVERTISEMENT
 1
1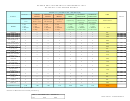 2
2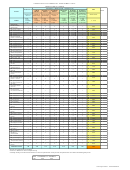 3
3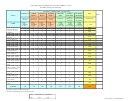 4
4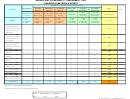 5
5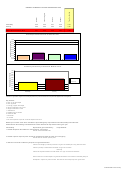 6
6 7
7HAZARD AND VULNERABILITY ASSESSMENT TOOL
TECHNOLOGIC EVENTS
SEVERITY = (MAGNITUDE - MITIGATION)
PROBABILITY
HUMAN
PROPERTY
BUSINESS
PREPARED-
INTERNAL
EXTERNAL
RISK
Notes
EVENT
IMPACT
IMPACT
IMPACT
NESS
RESPONSE
RESPONSE
Time,
Community/
Likelihood this
Possibility of
Physical losses
Interruption of
Preplanning
effectiveness,
Mutual Aid staff
Relative threat*
will occur
death or injury
and damages
services
resources
and supplies
0 = N/A
0 = N/A
0 = N/A
0 = N/A
0 = N/A
0 = N/A
0 = N/A
1 = Low
1 = Low
1 = Low
1 = Low
1 = High
1 = High
1 = High
SCORE
0 - 100%
2 = Moderate
2 = Moderate
2 = Moderate
2 = Moderate
2 = Moderate
2 = Moderate
2 = Moderate
3 = High
3 = High
3 = High
3 = High
3 = Low or none
3 = Low or none
3 = Low or none
Community
Air Plane Crash,
3
2
3
2
2
1
24%
1
Commercial
1
Biological Incident
3
2
3
3
3
2
30%
2
Chemical Incident
2
2
3
3
3
3
59%
1
Dam/Levee Failure
3
3
3
3
3
2
31%
1
Dirty Bomb
3
3
3
3
3
2
31%
Electrical Service
2
1
2
1
1
1
44%
Failure - Commercial
3
1
Explosion
2
2
2
2
2
1
20%
1
Fire -Large
3
3
3
3
3
2
31%
1
Natural Gas Loss
3
2
3
3
2
2
28%
2
Phone/Data Service
1
1
2
1
1
1
26%
Radiological Incident
3
3
3
3
3
2
63%
2
Sewer System Loss
1
2
2
2
2
1
19%
1
Strike/Transportation
1
1
1
1
1
1
11%
1
Water Contamination
3
2
3
2
2
2
26%
1
2
Water Loss - City
3
3
3
2
2
1
52%
2
Train Derailment
2
2
2
2
2
2
44%
Internal
Biological/Infection
3
1
2
1
3
2
67%
3
Control
Communications
1
1
2
2
2
1
17%
1
Systems Failure
Chemical Spill or
2
2
2
3
3
1
48%
2
Release
Commerical Power
1
1
1
1
1
2
39%
3
Failure
3
Data System Failure
1
1
1
1
1
1
33%
Electrical Distribution
2
2
2
2
2
1
41%
2
Failure - Internal
Emergency Alarms -
Not Clearly Heard in
2
2
2
3
3
1
72%
3
all areas
Evacuation Route
1
1
2
2
3
2
61%
3
Hazards
Facility Design/
1
1
1
2
2
1
30%
Construction Hazards
2
Fire Alarm Failure
1
3
3
3
2
2
1
26%
1
Fire, Internal
3
3
3
2
2
1
26%
Fire Watch
2
Flood, Internal
3
3
3
3
3
1
59%
1
30%
Fuel Shortage
3
3
3
3
3
1
1
Generator Failure
3
3
3
3
3
1
30%
Hazmat Exposure,
2
1
3
3
3
1
48%
2
Internal
1
HVAC Failure
2
1
2
2
2
2
20%
Information Systems
1
1
2
2
2
1
50%
3
Failure
Medical Gas Failure
3
1
3
2
3
3
56%
2
Medical Vacuum
2
1
2
2
3
2
44%
2
Failure
3
Mold/Mildew Growth
2
2
2
2
2
3
72%
1
Natural Gas Failure
1
1
2
2
2
2
19%
Radiological Incident
1
1
1
3
3
1
19%
1
Sewer Failure
0
2
2
3
3
1
20%
1
Sick Building
2
2
2
2
2
1
20%
1
Syndrome
Steam Failure
1
1
1
2
2
1
15%
1
Storage of
1
2
2
2
2
1
37%
2
Combustibles
Structural Damage
1
1
2
2
1
1
15%
1
2
Supply Shortage
2
1
3
2
2
1
41%
Transportation Failure
1
1
1
2
2
1
15%
1
Water Delivery System
3
1
2
2
2
1
61%
3
Failure
AVERAGE SCORE
1.66
1.96
1.72
2.19
2.15
2.21
1.40
36%
*Threat increases with percentage.
* Events in Bold have occurred previously
* Identify nearby sites & hazards where an off site spill/release could put the hospital within the chemical/radiological plume
RISK = PROBABILITY * SEVERITY
78
0.36
0.55
0.65
547
Technological Hazards : HVAlDetailedHM.xls
ADVERTISEMENT
0 votes
Related Articles
Related forms


Related Categories
Parent category: Business